-
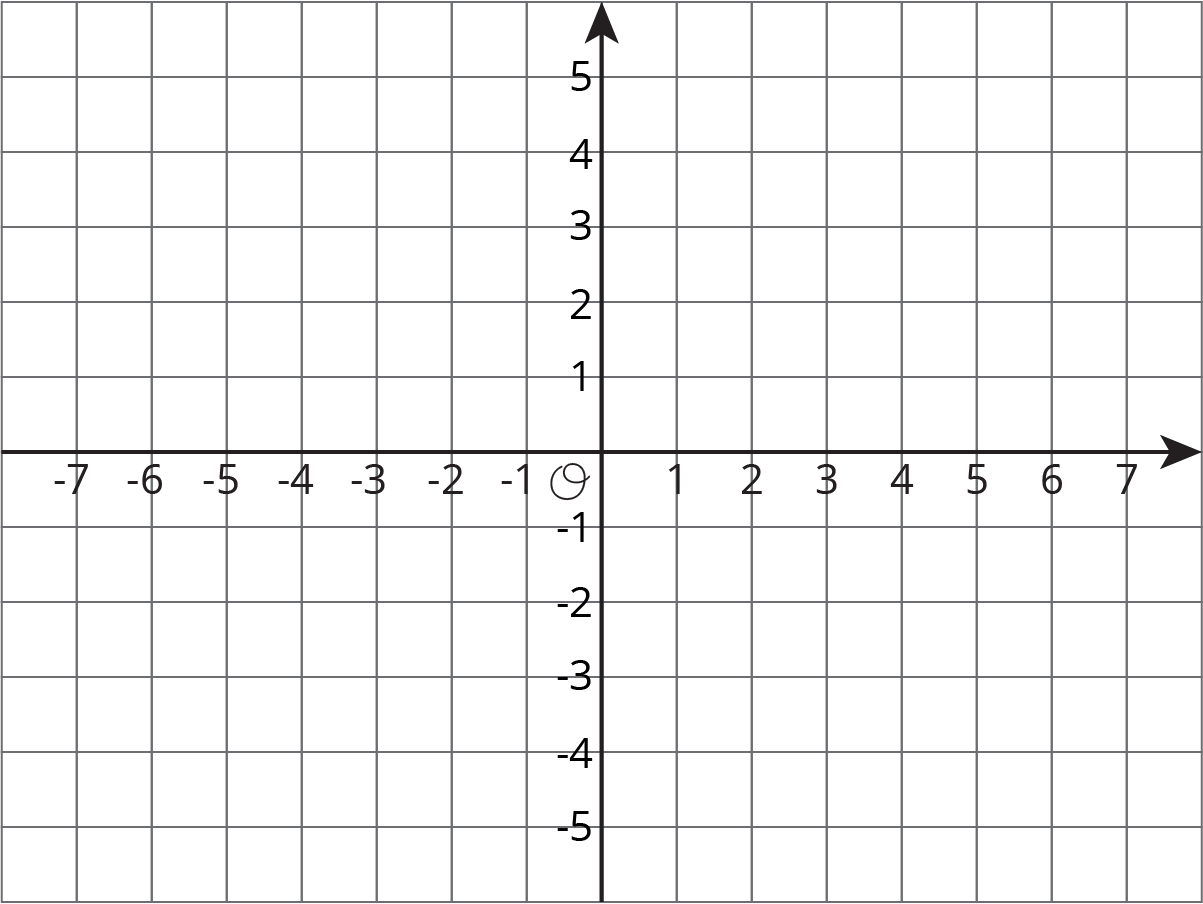
Plot the triangle in the coordinate plane and label the vertices.
-
Name the coordinates of 3 points that are inside the triangle.
Unit 8: Practice Problem Sets
Lesson 1
Problem 1
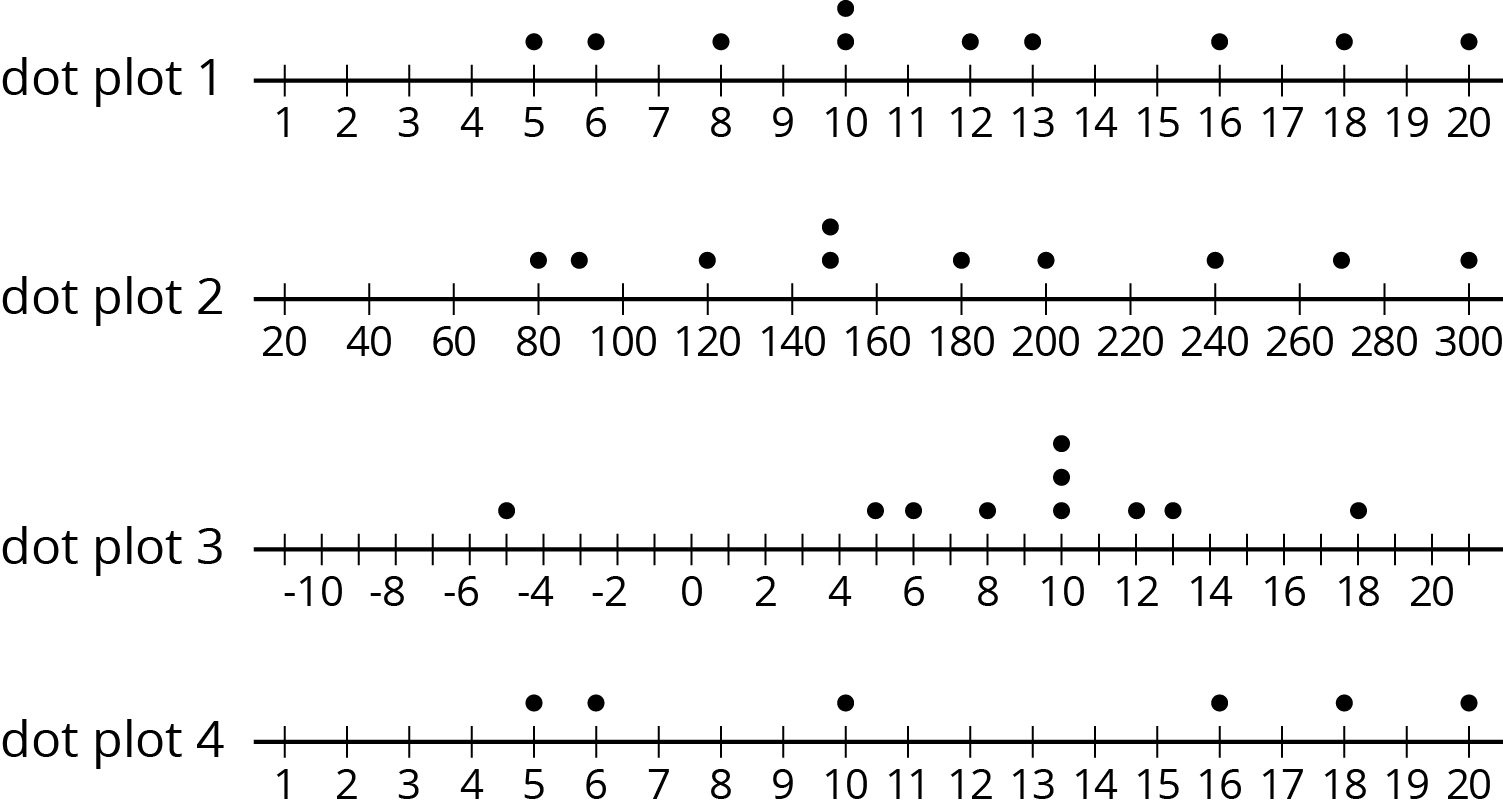
Tyler asked 10 students at his school how much time in minutes it takes them to get from home to school. Determine if each of these dot plots could represent the data Tyler collected. Explain your reasoning for each dot plot.
Problem 2
Here is a list of questions. For each question, decide if the responses will produce numerical data or categorical data and give two possible responses.
- What is your favorite breakfast food?
- How did you get to school this morning?
- How many different teachers do you have?
- What is the last thing you ate or drank?
- How many minutes did it take you to get ready this morning—from waking up to leaving for school?
Problem 3
- Write two questions that you could ask the students in your class that would result in categorical data. For each question, explain how you know that responses to it would produce categorical data.
- Write two questions that you could ask the students in your class that would result in numerical data. For each question, explain how you know that responses to it would produce numerical data.
Problem 4 (from Unit 7, Lesson 15)
Triangle $DEF$ has vertices $D=(\text-4, \text-4), E=(\text-2, \text-4)$, and $F=(\text-3, \text-1)$.
- What is the area of the triangle? Show your reasoning.
Lesson 2
Problem 1
Sixth-grade students were asked, “What grade are you in?” Explain why this is not a statistical question.
Problem 2
Lin and her friends went out for ice cream after school. The following questions came up during their trip. Select all the questions that are statistical questions.
- How far are we from the ice cream shop?
- What is the most popular ice cream flavor this week?
- What does a group of 4 people typically spend on ice cream at this shop?
- Do kids usually prefer to get a cup or a cone?
- How many toppings are there to choose from?
Problem 3
Here is a list of questions about the students and teachers at a school. Select all the questions that are statistical questions.
- What is the most popular lunch choice?
- What school do these students attend?
- How many math teachers are in the school?
- What is a common age for the teachers at the school?
- About how many hours of sleep do students generally get on a school night?
- How do students usually travel from home to school?
Problem 4
Here is a list of statistical questions. What data would you collect and analyze to answer each question? For numerical data, include the unit of measurement that you would use.
- What is a typical height of female athletes on a team in the most recent international sporting event?
- Are most adults in the school football fans?
- How long do drivers generally need to wait at a red light in Washington, DC?
Problem 5 (from Unit 7, Lesson 13)
Describe the scale you would use on the coordinate plane to plot each set of points. What value would you assign to each unit of the grid?
- $(1, \text-6)$, $(\text-7, \text-8)$, $(\text-3, 7)$, $(0, 9)$
- $(\text-20, \text-30)$, $(\text-40, 10)$, $(20, \text-10)$, $(5, \text-20)$
- $(\frac {\text{-}1}{3},\text-1), (\frac{2}{3}, \text-1 \frac13), (\frac {\text{-}4}{3},\frac23), (\frac16, 0)$
Problem 6 (from Unit 7, Lesson 9)
Noah’s water bottle contains more than 1 quart of water but less than $1 \frac{1}{2}$ quarts. Let $w$ be the amount of water in Noah’s bottle, in quarts. Select all the true statements.
- $w$ could be $\frac{3}{4}$.
- $w$ could be 1.
- $w > 1$
- $w$ could be $\frac 4 3$.
- $w$ could be $\frac 5 4$.
- $w$ could be $\frac 5 3$.
- $w > 1.5$
Problem 7 (from Unit 7, Lesson 7)
Order these numbers from least to greatest:
$|\text-17|$
$|\text-18|$
-18
$|19|$
20
Lesson 3
Problem 1
A teacher drew a line segment that was 20 inches long on the blackboard. She asked each of her students to estimate the length of the segment and used their estimates to draw this dot plot.

- How many students were in the class?
- Were students generally accurate in their estimates of the length of the line? Explain your reasoning.
Problem 2
Here are descriptions of data sets. Select all descriptions of data sets that could be graphed as dot plots.
- Class size for the classes at an elementary school
- Colors of cars in a parking lot
- Favorite sport of each student in a sixth-grade class
- Birth weights for the babies born during October at a hospital
- Number of goals scored in each of 20 games played by a school soccer team
Problem 3
Priya recorded the number of attempts it took each of 12 of her classmates to successfully throw a ball into a basket. Make a dot plot of Priya’s data.
| 1 | 2 | 1 | 3 | 1 | 4 | 4 | 3 | 1 | 2 | 5 | 2 |
Problem 4 (from Unit 6, Lesson 4)
Solve each equation.
- $9v = 1$
- $1.37w=0$
- $1 = \frac{7}{10} x$
- $12.1 = 12.1 + y $
- $\frac35 + z = 1$
Problem 5 (from Unit 4, Lesson 11)
Find the quotients.
- $\frac{2}{5} \div 2$
- $\frac{2}{5} \div 5$
- $2 \div \frac{2}{5}$
- $5\div \frac{2}{5}$
Problem 6 (from Unit 1, Lesson 9)
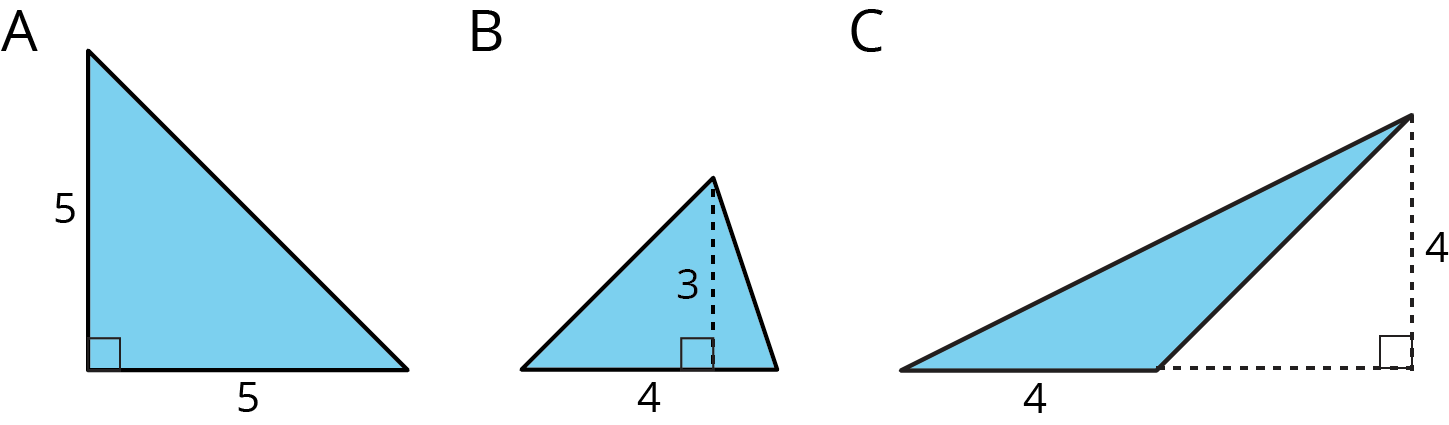
Find the area of each triangle.
Lesson 4
Problem 1
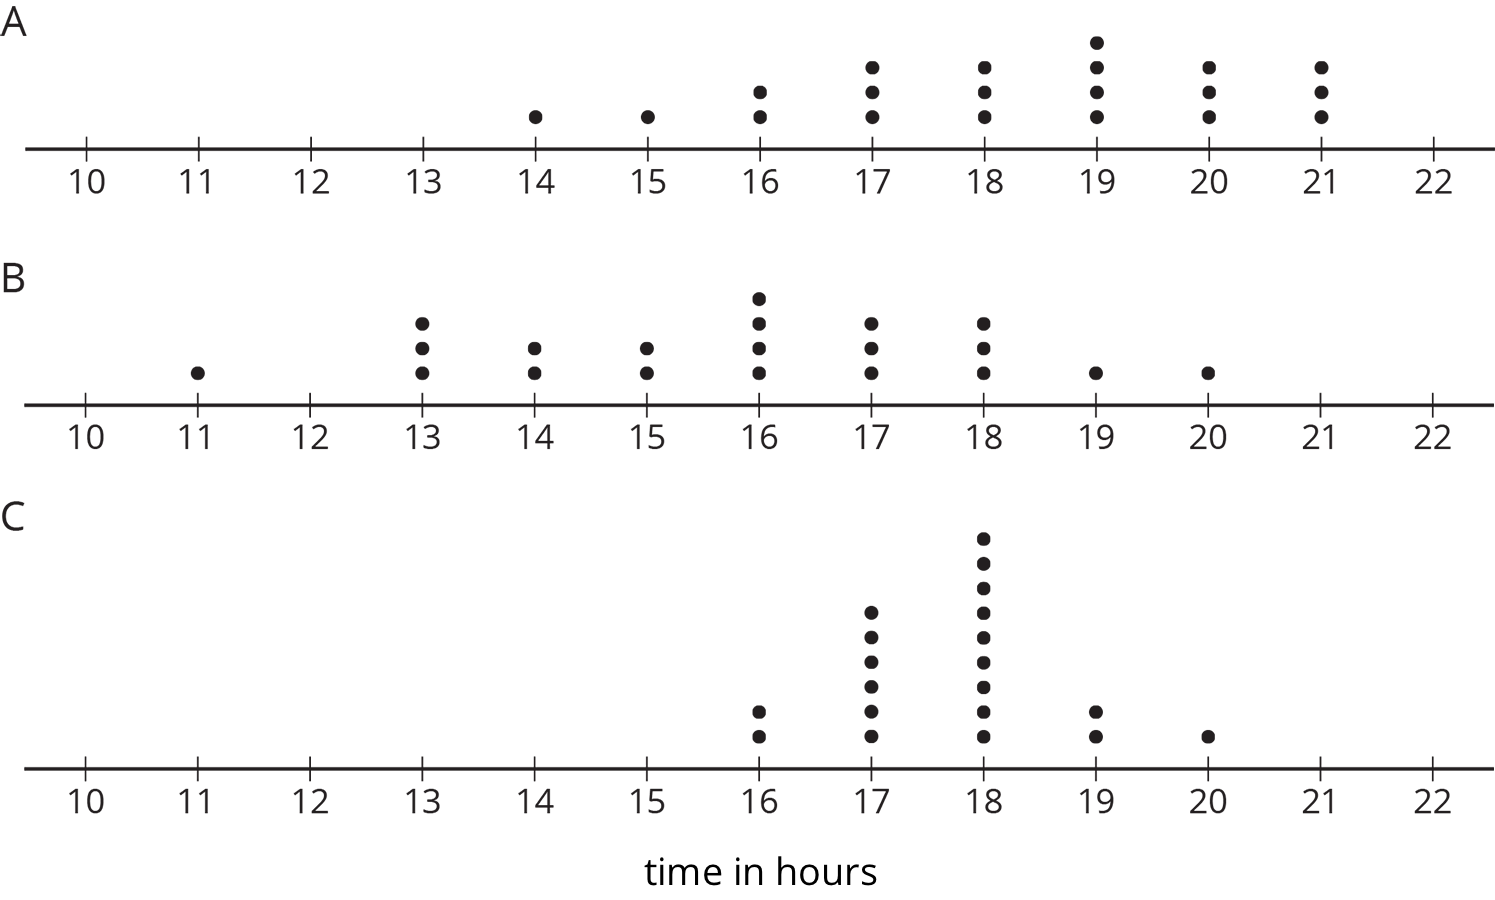
Clare recorded the amounts of time spent doing homework, in hours per week, by students in sixth, eighth, and tenth grades. She made a dot plot of the data for each grade and provided the following summary.
- Students in sixth grade tend to spend less time on homework than students in eighth and tenth grades.
-
The homework times for the tenth-grade students are more alike than the homework times for the eighth-grade students.
Use Clare's summary to match each dot plot to the correct grade (sixth, eighth, or tenth).
Problem 2
Mai played 10 basketball games. She recorded the number of points she scored and made a dot plot. Mai said that she scored between 8 and 14 points in most of the 10 games, but one game was exceptional. During that game she scored more than double her typical score of 9 points. Use the number line to make a dot plot that fits the description Mai gave.

Problem 3
A movie theater is showing three different movies. The dot plots represent the ages of the people who were at the Saturday afternoon showing of each of these movies.

- One of these movies was an animated movie rated G for general audiences. Do you think it was Movie A, B, or C? Explain your reasoning.
- Which movie has a dot plot with ages that that center at about 30 years?
- What is a typical age for the people who were at Movie A?
Problem 4 (from Unit 5, Lesson 13)
Find the value of each expression.
- $3.727 + 1.384$
- $3.727 - 1.384$
- $5.01 \boldcdot 4.8$
- $5.01 \div 4.8$
Lesson 5
Problem 1
Three sets of data about ten sixth-grade students were used to make three dot plots. The person who made these dot plots forgot to label them. Match each dot plot with the appropriate label.
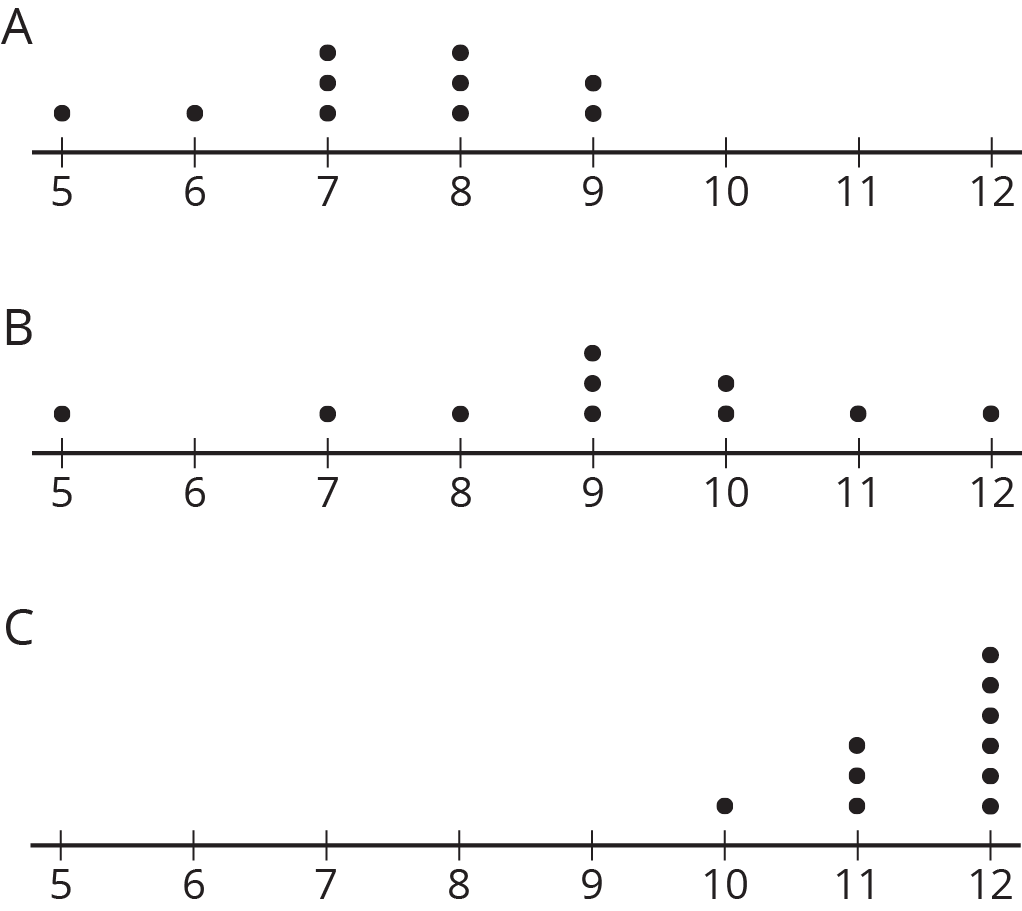
- Ages in years
- Numbers of hours of sleep on nights before school days
- Numbers of hours of sleep on nights before non-school days
Problem 2
The dot plots show the time it takes to get to school for ten sixth-grade students from the United States, Canada, Australia, New Zealand, and South Africa.

- List the countries in order of typical travel times, from shortest to longest.
- List the countries in order of variability in travel times, from the least variability to the greatest.
Problem 3
Twenty-five students were asked to rate—on a scale of 0 to 10—how important it is to reduce pollution. A rating of 0 means “not at all important” and a rating of 10 means “very important.” Here is a dot plot of their responses.
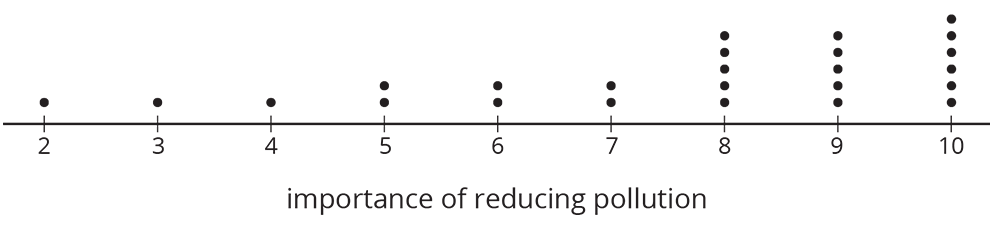
Explain why a rating of 6 is not a good description of the center of this data set.
Problem 4 (from Unit 7, Lesson 10)
Tyler wants to buy some cherries at the farmer’s market. He has \$10 and cherries cost \$4 per pound.
- If $c$ is the number of pounds of cherries that Tyler can buy, write one or more inequalities or equations describing $c$.
- Can 2 be a value of $c$? Can 3 be a value of $c$? What about -1? Explain your reasoning.
- If $m$ is the amount of money, in dollars, Tyler can spend, write one or more inequalities or equations describing $m$.
- Can 8 be a value of $m$? Can 2 be a value of $m$? What about 10.5? Explain your reasoning.
Lesson 6
Problem 1
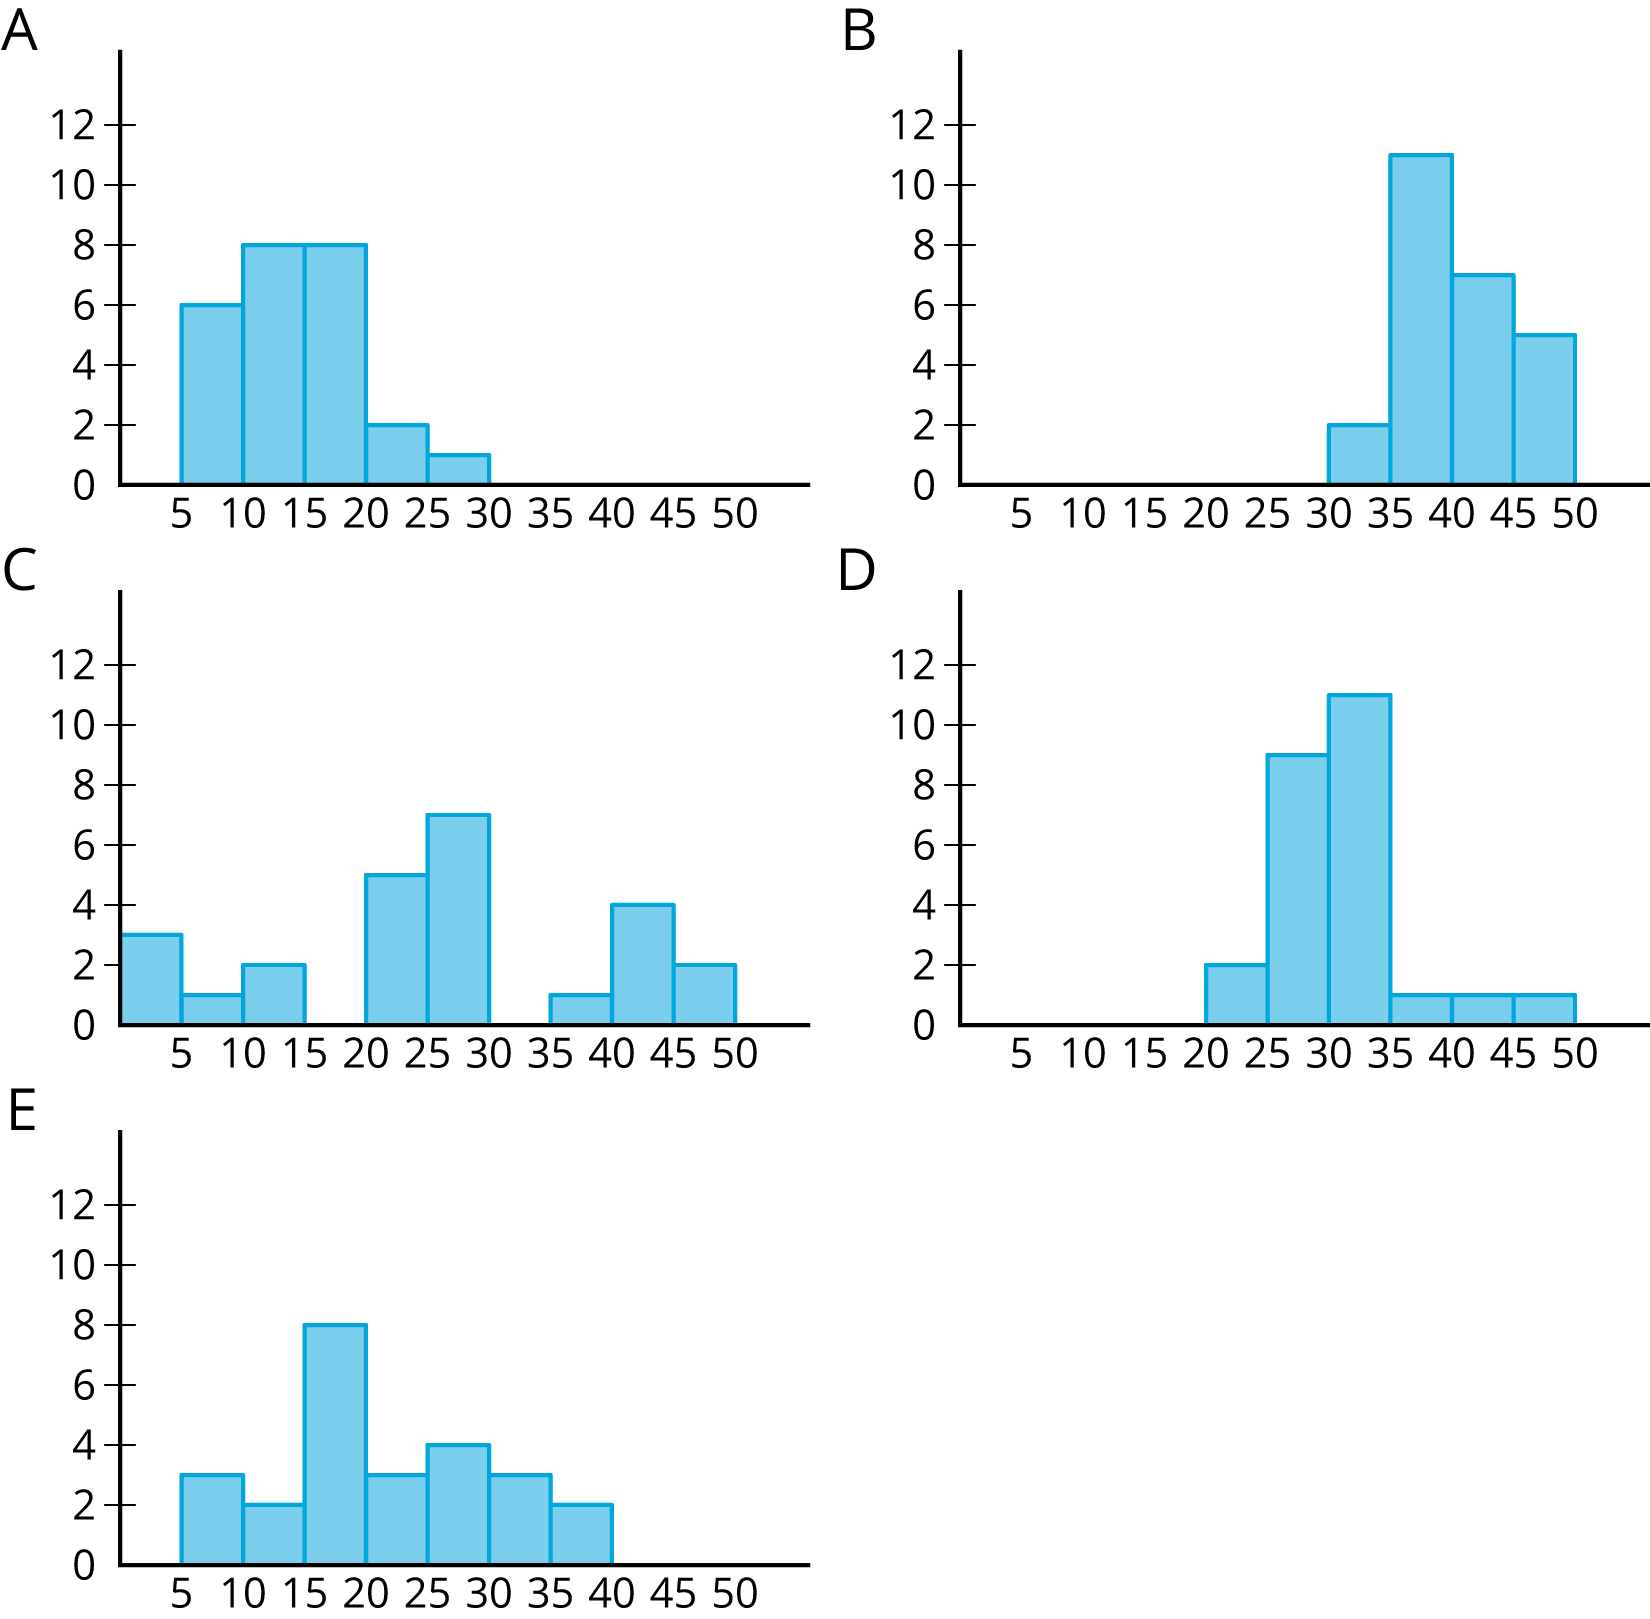
Match histograms A through E to dot plots 1 through 5 so that each match represents the same data set.

Problem 2
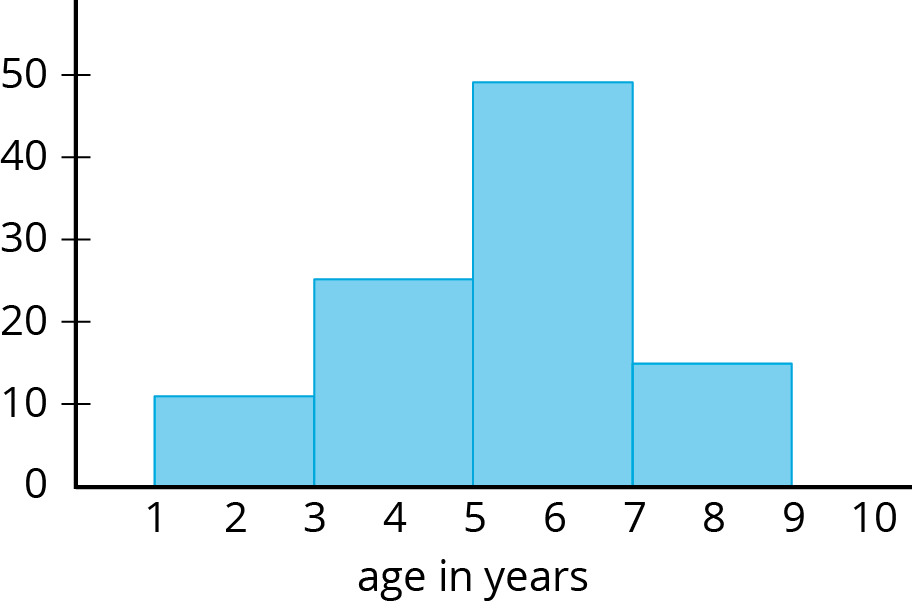
Here is a histogram that summarizes the lengths, in feet, of a group of adult female sharks. Select all the statements that are true, according to the histogram.

- A total of 9 sharks were measured.
- A total of 50 sharks were measured.
- The longest shark that was measured was 10 feet long.
- Most of the sharks that were measured were over 16 feet long.
- Two of the sharks that were measured were less than 14 feet long.
Problem 3
This table shows the times, in minutes, it took 40 sixth-grade students to run 1 mile.
| time (minutes) | frequency | |
|---|---|---|
| row 1 | 4 to less than 6 | 1 |
| row 2 | 6 to less than 8 | 5 |
| row 3 | 8 to less than 10 | 13 |
| row 4 | 10 to less than 12 | 12 |
| row 5 | 12 to less than 14 | 7 |
| row 6 | 14 to less than 16 | 2 |
Draw a histogram for the information in the table.
Problem 4 (from Unit 7, Lesson 12)
$(\text-2, 3)$ is one vertex of a square on a coordinate plane. Name three points that could be the other vertices.
Lesson 7
Problem 1
These two histograms show the number of text messages sent in one week by two groups of 100 students. The first histogram summarizes data from sixth-grade students. The second histogram summarizes data from seventh-grade students.
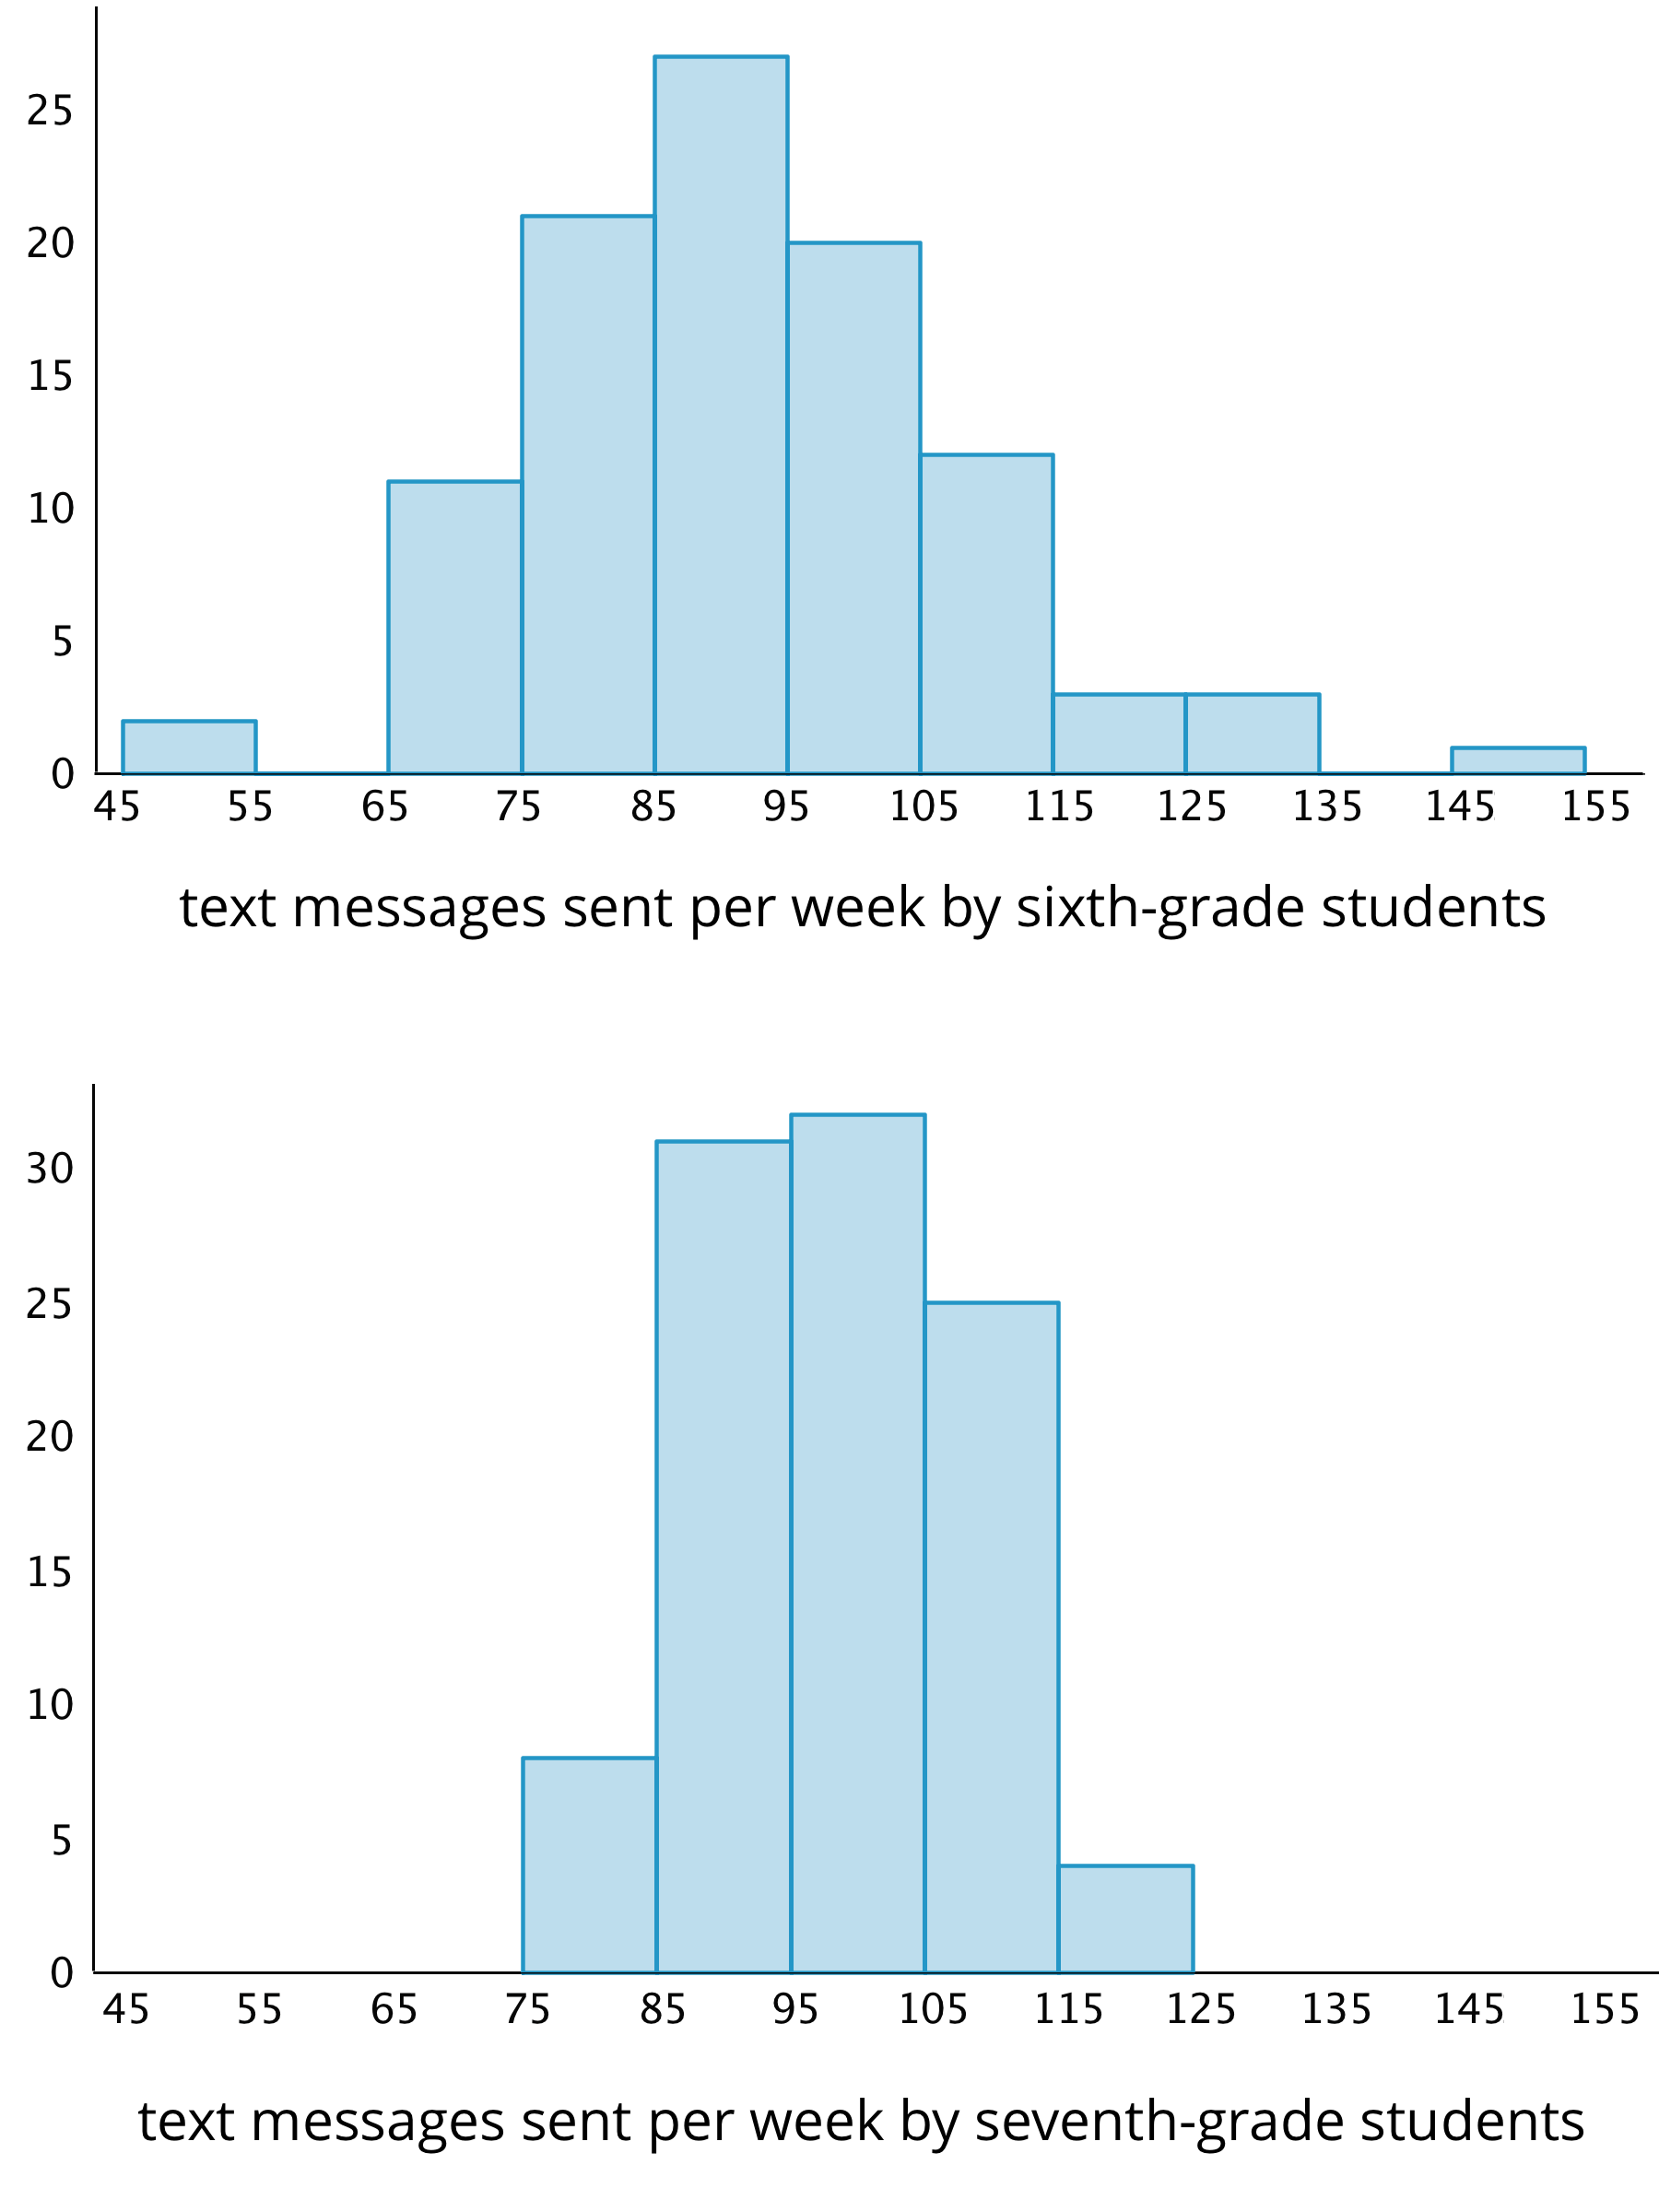
a. Do the two data sets have approximately the same center? If so, explain where the center is located. If not, which one has the greater center?
b. Which data set has greater spread? Explain your reasoning.
- Overall, which group of students—sixth- or seventh-grade—sent more text messages?
Problem 2
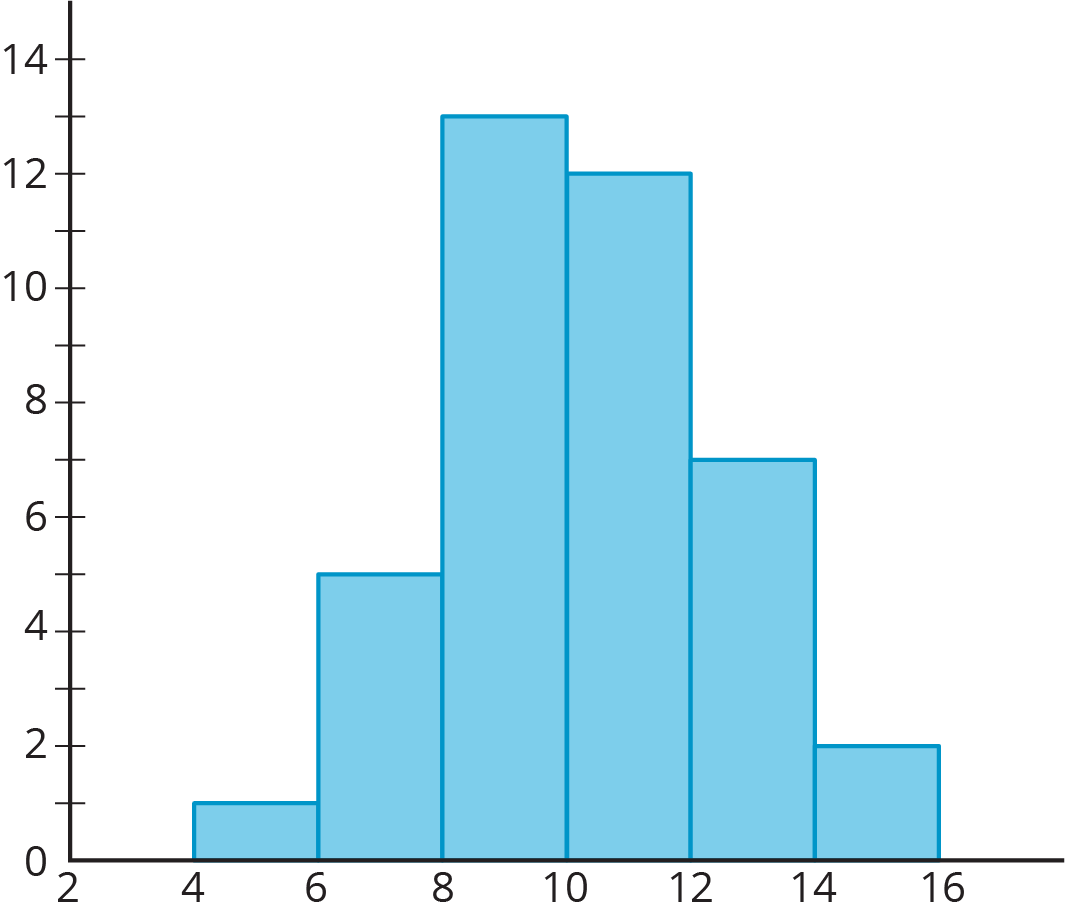
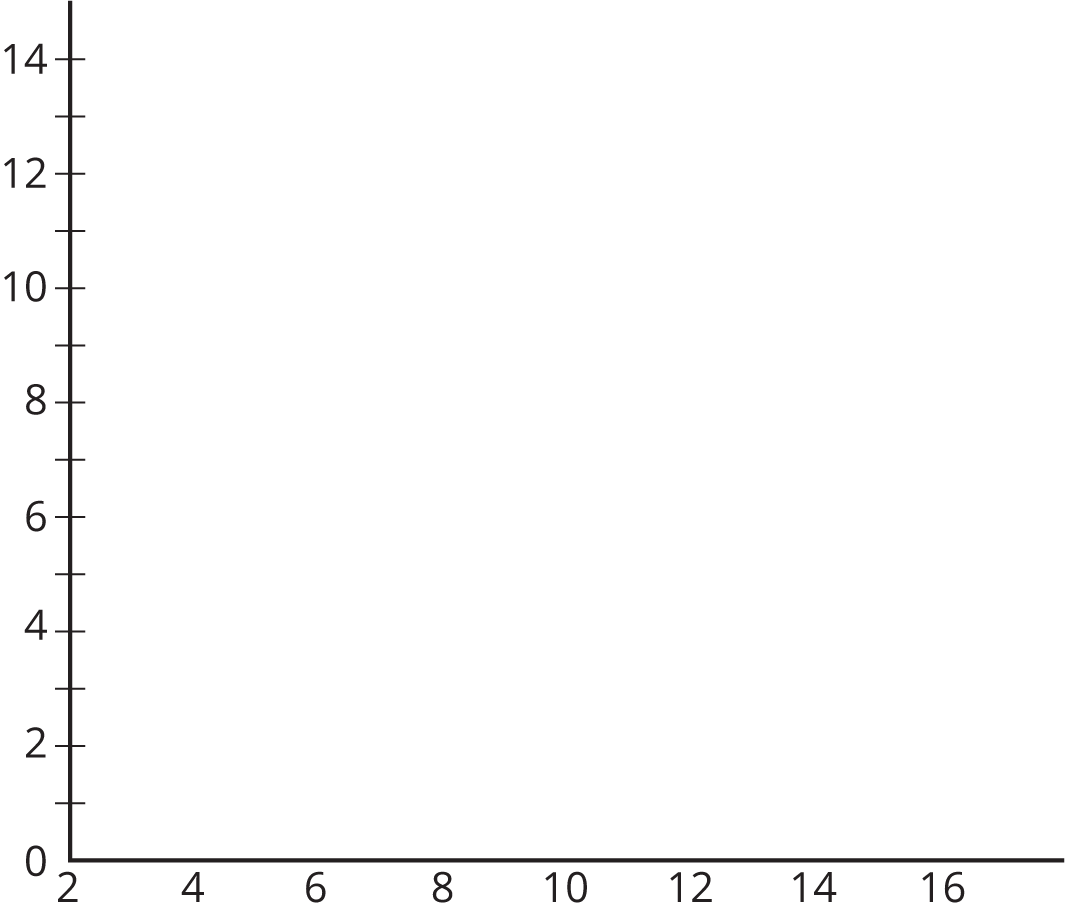
Forty sixth-grade students ran 1 mile. Here is a histogram that summarizes their times, in minutes. The center of the distribution is approximately 10 minutes.
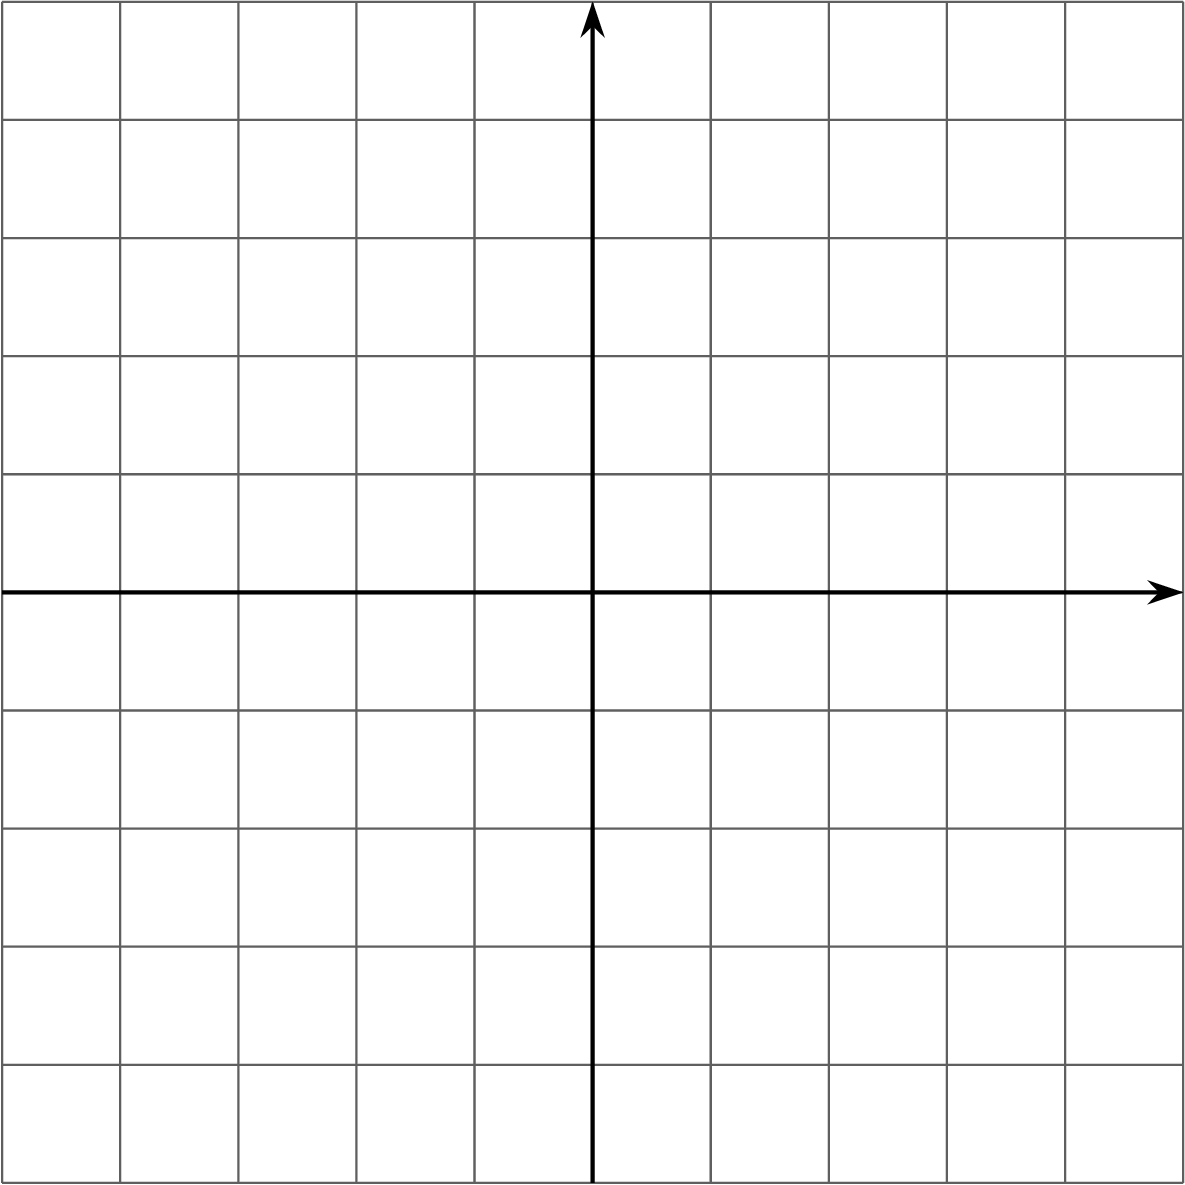
On the blank axes, draw a second histogram that has:
- a distribution of times for a different group of 40 sixth-grade students.
- a center at 10 minutes.
- less variability than the distribution shown in the first histogram.
Problem 3 (from Unit 7, Lesson 9)
Jada has $d$ dimes. She has more than 30 cents but less than a dollar.
- Write two inequalities that represent how many dimes Jada has.
- Can $d$ be 10?
- How many possible solutions make both inequalities true? If possible, describe or list the solutions.
Problem 4 (from Unit 7, Lesson 4)
Order these numbers from greatest to least: $\text-4$, $\frac14$, 0, 4, $\text{-}3\frac{1}{2}$, $\frac74$, $\text{-}\frac{5}{4}$
Lesson 8
Problem 1
The histogram summarizes the data on the body lengths of 143 wild bears. Write a few sentences describing the distribution of body lengths.
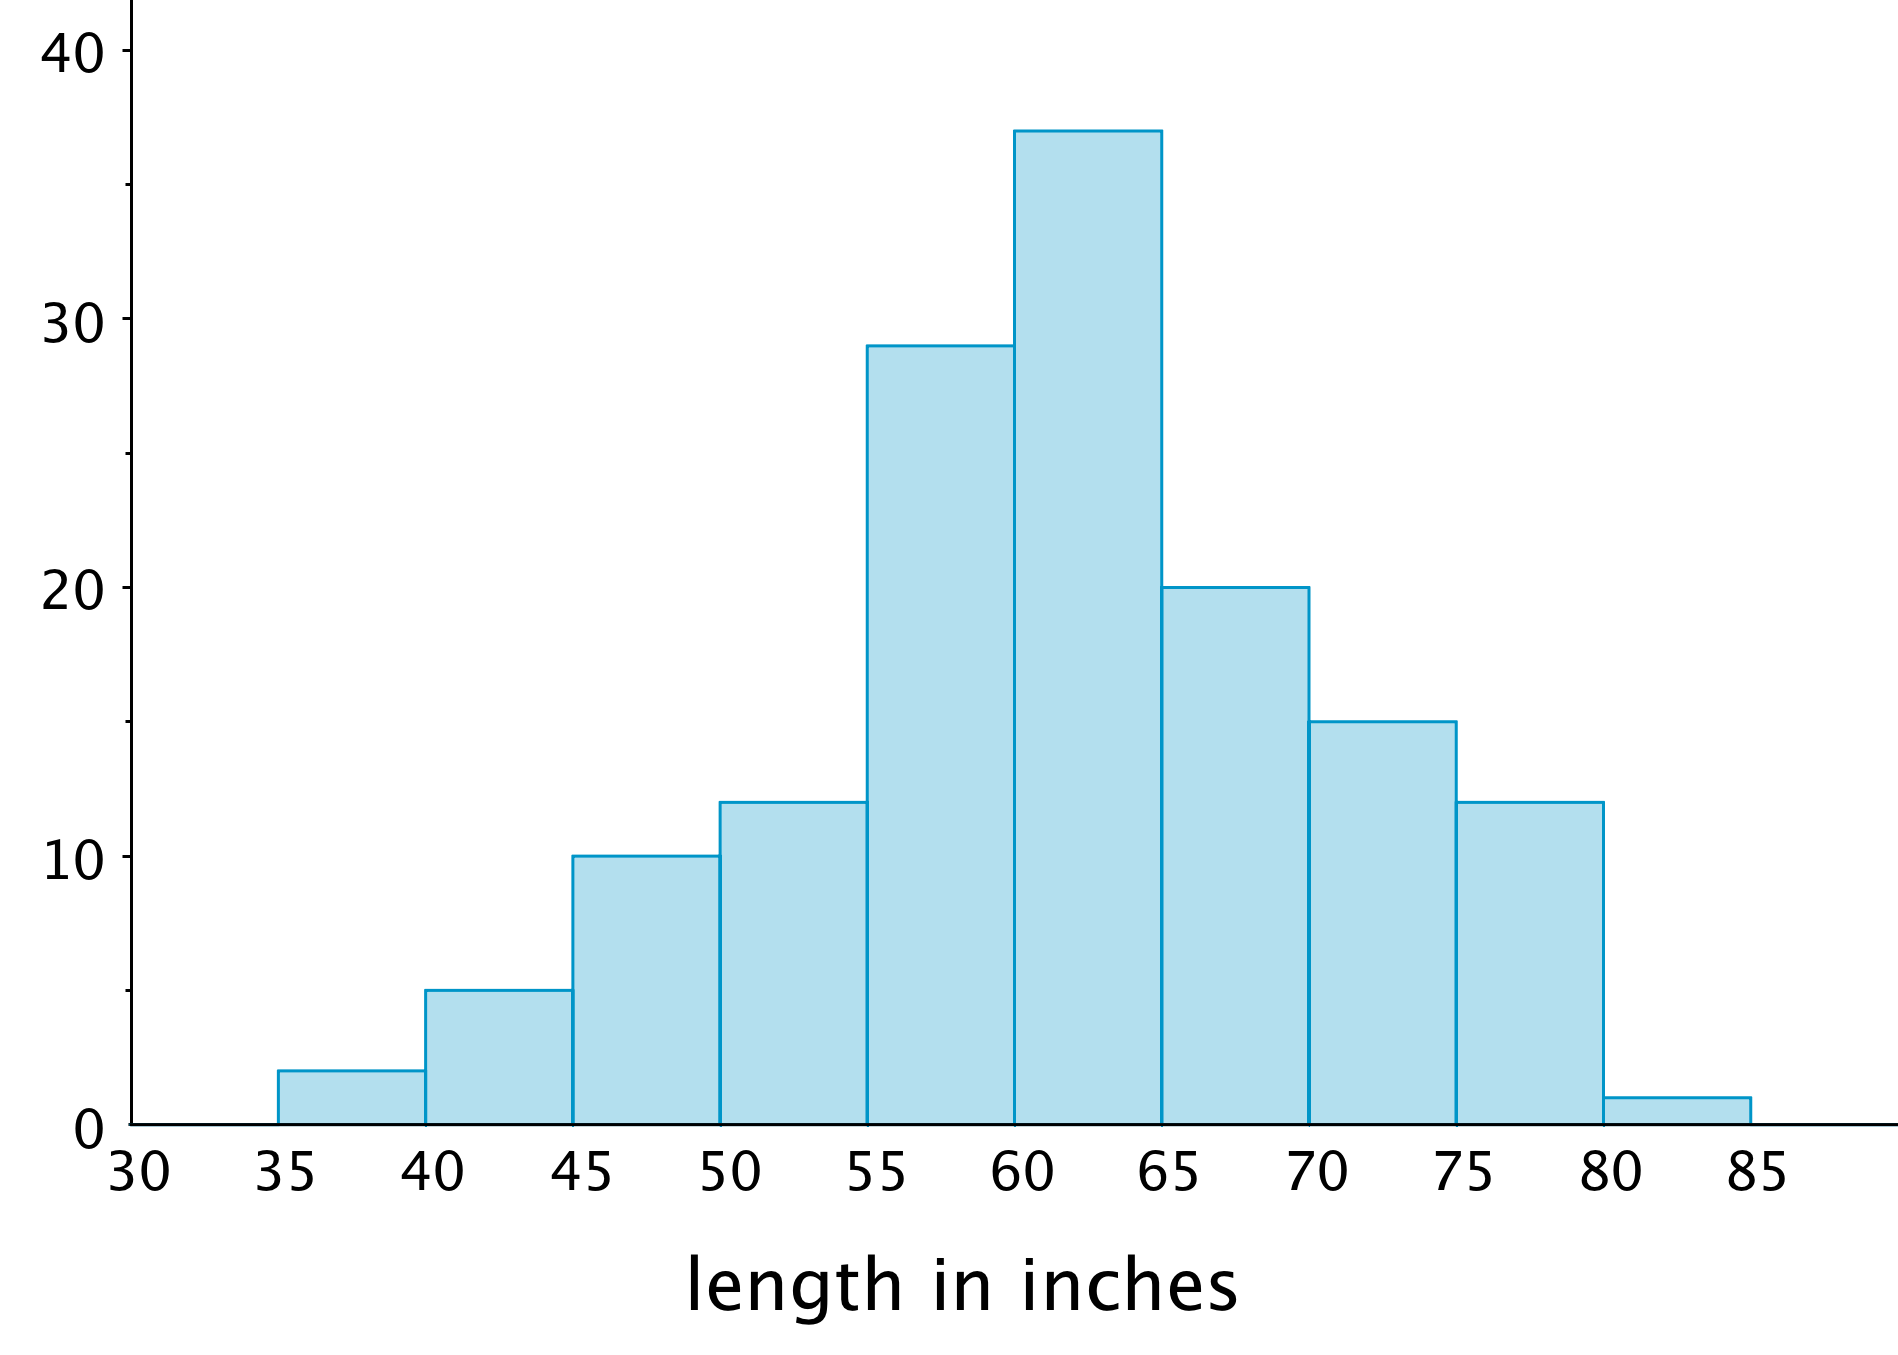
Be sure to comment on shape, center, and spread of the distribution.
Problem 2
Which data set is more likely to produce a histogram with a symmetric distribution? Explain your reasoning.
- Data on the number of seconds on a track of music in a pop album.
-
Data on the number of seconds spent talking on the phone yesterday by everyone in the school.
Problem 3
Decide if each data set might produce one or more gaps when represented by a histogram. For each data set that you think might produce gaps, briefly describe or give an example of how the values in the data set might do so.
- The ages of students in a sixth-grade class.
- The ages of people in an elementary school.
- The ages of people eating in a family restaurant.The ages of people who watch football.
- The ages of runners in a marathon.
Problem 4 (from Unit 6, Lesson 15)
Evaluate the expression $4x^3$ for each value of $x$.
- 1
- 2
- $\frac{1}{2}$
Problem 5 (from Unit 6, Lesson 7)
Jada drank 12 ounces of water from her bottle. This is 60% of the water the bottle holds.
- Write an equation to represent this situation. Explain the meaning of any variables you use.
- How much water does the bottle hold?
Lesson 9
Problem 1
A preschool teacher is rearranging four boxes of playing blocks so that each box contains an equal number of blocks. Currently Box 1 has 32 blocks, Box 2 has 18, Box 3 has 41, and Box 4 has 9.
Select all the ways he could make each box have the same number of blocks.
- Remove all the blocks and make four equal piles of 25, then put each pile in one of the boxes.
- Remove 7 blocks from Box 1 and place them in Box 2.
- Remove 21 blocks from Box 3 and place them in Box 4.
- Remove 7 blocks from Box 1 and place them in Box 2, and remove 21 blocks from Box 3 and place them in Box 4.
- Remove 7 blocks from Box 1 and place them in Box 2, and remove 16 blocks from Box 3 and place them in Box 4.
Problem 2
In a round of mini-golf, Clare records the number of strokes it takes to hit the ball into the hole of each green. She said that, if she redistributed the strokes on different greens, she could tell that her average number of strokes per hole is 3.
| 2 | 3 | 1 | 4 | 5 | 2 | 3 | 4 | 3 |
Explain how Clare is correct.
Problem 3
Three sixth-grade classes raised \$25.50, \$49.75, and \$37.25 for their classroom libraries. They agreed to share the money raised equally. What is each class’s equal share? Explain or show your reasoning.
Problem 4
In her English class, Mai’s teacher gives 4 quizzes each worth 5 points. After 3 quizzes, she has the scores 4, 3, and 4. What does she need to get on the last quiz to have a mean score of 4? Explain or show your reasoning.
Problem 5 (from Unit 8, Lesson 7)
An earthworm farmer examined two containers of a certain species of earthworms so that he could learn about their lengths. He measured 25 earthworms in each container and recorded their lengths in millimeters.
Here are histograms of the lengths for each container.
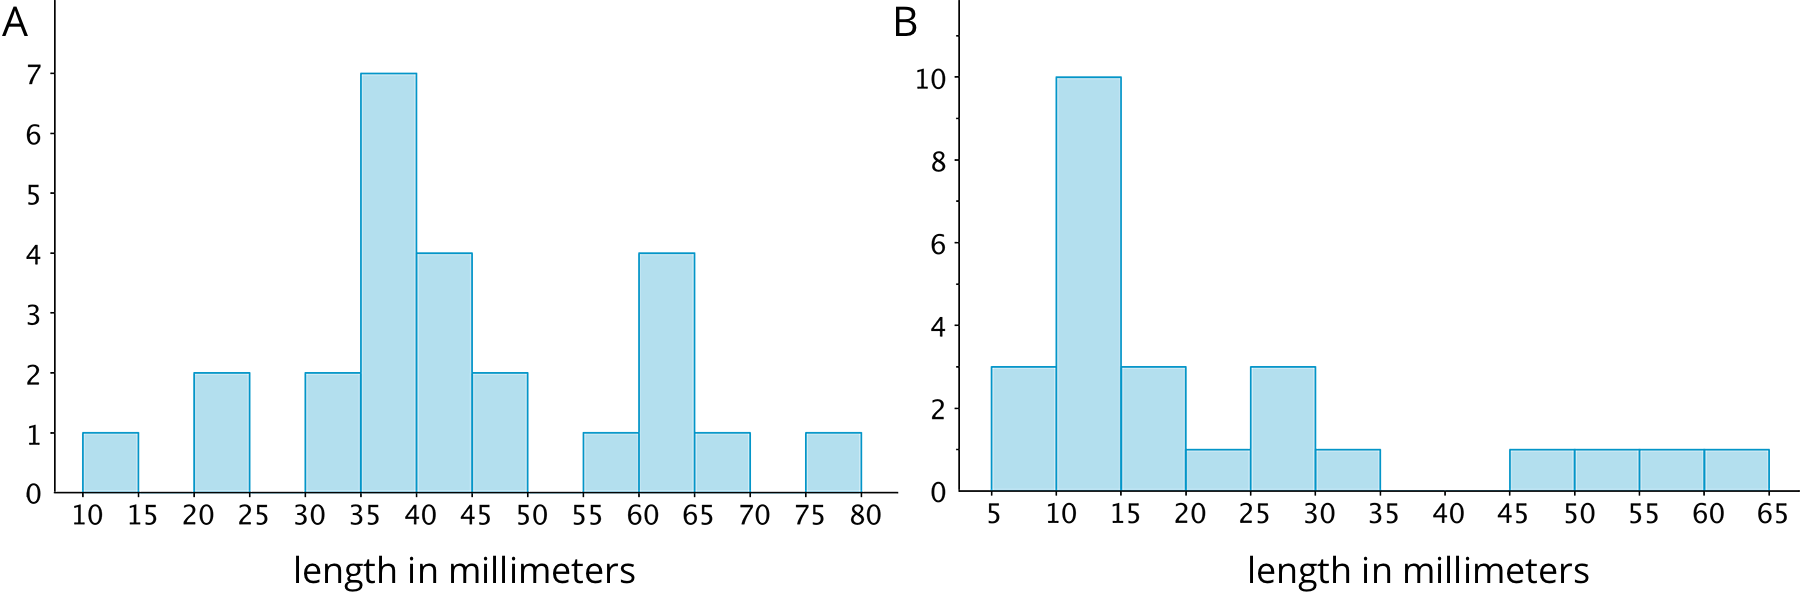
- Which container tends to have longer worms than the other container?
- For which container would 15 millimeters be a reasonable description of a typical length of the worms in the container?
- If length is related to age, which container had the most young worms?
Problem 6 (from Unit 6, Lesson 15)
Diego thinks that $x=3$ is a solution to the equation $x^2 = 16$. Do you agree? Explain or show your reasoning.
Lesson 10
Problem 1
On school days, Kiran walks to school. Here are the lengths of time, in minutes, for Kiran’s walks on 5 school days.
- Create a dot plot for Kiran’s data.
| 16 | 11 | 18 | 12 | 13 |
- Without calculating, decide if 15 minutes would be a good estimate of the mean. If you think it is a good estimate, explain your reasoning. If not, give a better estimate and explain your reasoning.
- Calculate the mean for Kiran’s data.
- In the table, record the distance of each data point from the mean and its location relative to the mean.
time in minutes distance from the mean left or right of the mean? row 1 16 row 2 11 row 3 18 row 4 12 row 5 13 - Calculate the sum of all distances to the left of the mean, then calculate the sum of distances to the right of the mean. Explain how these sums show that the mean is a balance point for the values in the data set.
Problem 2
Noah scored 20 points in a game. Mai's score was 30 points. The mean score for Noah, Mai, and Clare was 40 points. What was Clare's score? Explain or show your reasoning.
Problem 3 (from Unit 7, Lesson 7)
Compare the numbers using >, <, or =.
- $\text-2$ _____ $3$
- $|\text-12|$ _____ $|15|$
- $3$ _____ $\text-4$
- $|15|$ _____ $|\text-12|$
- $7$ _____ $\text-11$
- $\text-4$ _____ $|5|$
Problem 4 (from Unit 7, Lesson 3)
-
Plot $\frac{2}{3}$ and $\frac{3}{4}$ on a number line.
- Is $\frac{2}{3} < \frac{3}{4}$, or is $\frac{3}{4} < \frac{2}{3}$? Explain how you know.
Problem 5 (from Unit 6, Lesson 10)
Select all expressions that represent the total area of the large rectangle.
- $5(x+y)$
- $5 + xy$
- $5x + 5y$
- $2(5+x + y)$
- $5xy$

Lesson 11
Problem 1
Han recorded the number of pages that he read each day for five days. The dot plot shows his data.
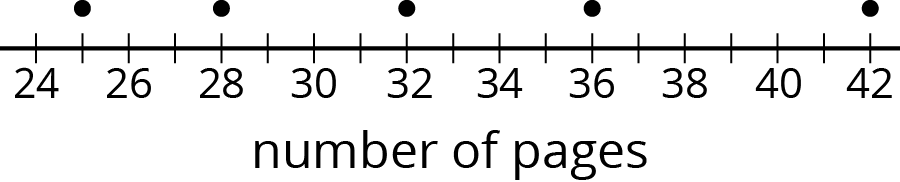
a. Is 30 pages a good estimate of the mean number of pages that Han read each day? Explain your reasoning.
- Find the mean number of pages that Han read during the five days. Draw a triangle to mark the mean on the dot plot.
- Use the dot plot and the mean to complete the table.
number of pages distance from mean left or right of mean row 1 25 left row 2 28 row 3 32 row 4 36 row 5 42 - Calculate the mean absolute deviation (MAD) of the data. Explain or show your reasoning.
Problem 2
Ten sixth-grade students recorded the amounts of time each took to travel to school. The dot plot shows their travel times.

The mean travel time for these students is approximately 9 minutes. The MAD is approximately 4.2 minutes.
- Which number of minutes—9 or 4.2—is a typical amount of time for the ten sixth-grade students to travel to school? Explain your reasoning.
- Based on the mean and MAD, Jada believes that travel times between 5 and 13 minutes are common for this group. Do you agree? Explain your reasoning.
- A different group of ten sixth-grade students also recorded their travel times to school. Their mean travel time was also 9 minutes, but the MAD was about 7 minutes. What could the dot plot of this second data set be? Describe or draw how it might look.
Problem 3
In an archery competition, scores for each round are calculated by averaging the distance of 3 arrows from the center of the target.
An archer has a mean distance of 1.6 inches and a MAD distance of 1.3 inches in the first round. In the second round, the archer's arrows are farther from the center but are more consistent. What values for the mean and MAD would fit this description for the second round? Explain your reasoning.
Lesson 12
Problem 1
The dot plots show the amounts of time that ten U.S. students and ten Australian students took to get to school. Which statement is true about the MAD of the Australian data set?

- It is significantly less than the MAD of the U.S. data set.
- It is exactly equal to the MAD of the U.S. data set.
- It is approximately equal to the MAD of the U.S. data set.
- It is significantly greater than the MAD of the U.S. data set.
Problem 2
The dot plots show the amounts of time that ten South African students and ten Australian students took to get to school. Without calculating, answer the questions.

- Which data set has the smaller mean? Explain your reasoning.
- Which data set has the smaller MAD? Explain your reasoning.
- What does a smaller mean tell us in this context?
- What does a smaller MAD tell us in this context?
Problem 3
Two high school basketball teams have identical records of 15 wins and 2 losses. Sunnyside High School's mean score is 50 points and its MAD is 4 points. Shadyside High School's mean score is 60 points and its MAD is 15 points.
Lin read the records of each team’s score. She likes the team that had nearly the same score for every game it played. Which team do you think Lin likes? Explain your reasoning.
Problem 4 (from Unit 6, Lesson 8)
Jada thinks the perimeter of this rectangle can be represented with the expression $a+a+b+b$. Andre thinks it can be represented with $2a+2b$.
Do you agree with either, both, or neither of them? Explain your reasoning.

Problem 5 (from Unit 7, Lesson 3)
Draw a number line.
- Plot and label three numbers between -2 and -8 (not including -2 and -8).
- Use the numbers you plotted and the symbols $<$ and $>$ to write three inequality statements.
Problem 6 (from Unit 8, Lesson 2)
Adult elephant seals generally weigh about 5,500 pounds. If you weighed 5 elephant seals, would you expect each seal to weigh exactly 5,500 pounds? Explain your reasoning.
Lesson 13
Problem 1
Here is a table that shows student's scores for 10 rounds of a video game.
| row 1 | 130 | 150 | 120 | 170 | 130 | 120 | 160 | 160 | 190 | 140 |
|---|
What is the median score?
- 125
- 145
- 147
- 150
Problem 2
When he sorts the class’s scores on the last test, the teacher notices that exactly 12 students scored better than Clare and exactly 12 students scored worse than Clare. Does this mean that Clare’s score on the test is the median? Explain your reasoning.
Problem 3
The medians of the following dot plots are 6, 12, 13, and 15, but not in that order. Match each dot plot with its median.

Problem 4
Invent a data set with five numbers that has a mean of 10 and a median of 12.
Problem 5 (from Unit 8, Lesson 10)
Ten sixth-grade students reported the hours of sleep they get on nights before a school day. Their responses are recorded in the dot plot.
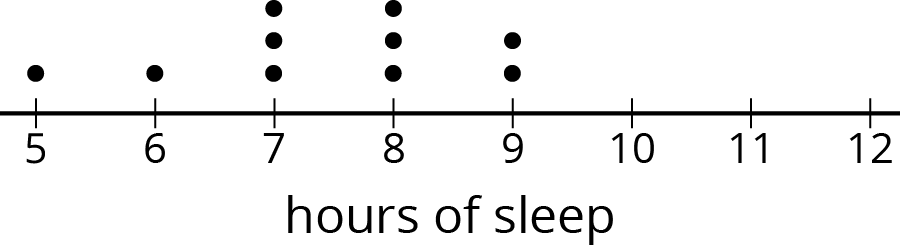
Looking at the dot plot, Lin estimated the mean number of hours of sleep to be 8.5 hours. Noah's estimate was 7.5 hours. Diego's estimate was 6.5 hours.
Which estimate do you think is best? Explain how you know.
Problem 6 (from Unit 8, Lesson 8)
In one study of wild bears, researchers measured the weights, in pounds, of 143 wild bears that ranged in age from newborn to 15 years old. The data were used to make this histogram.
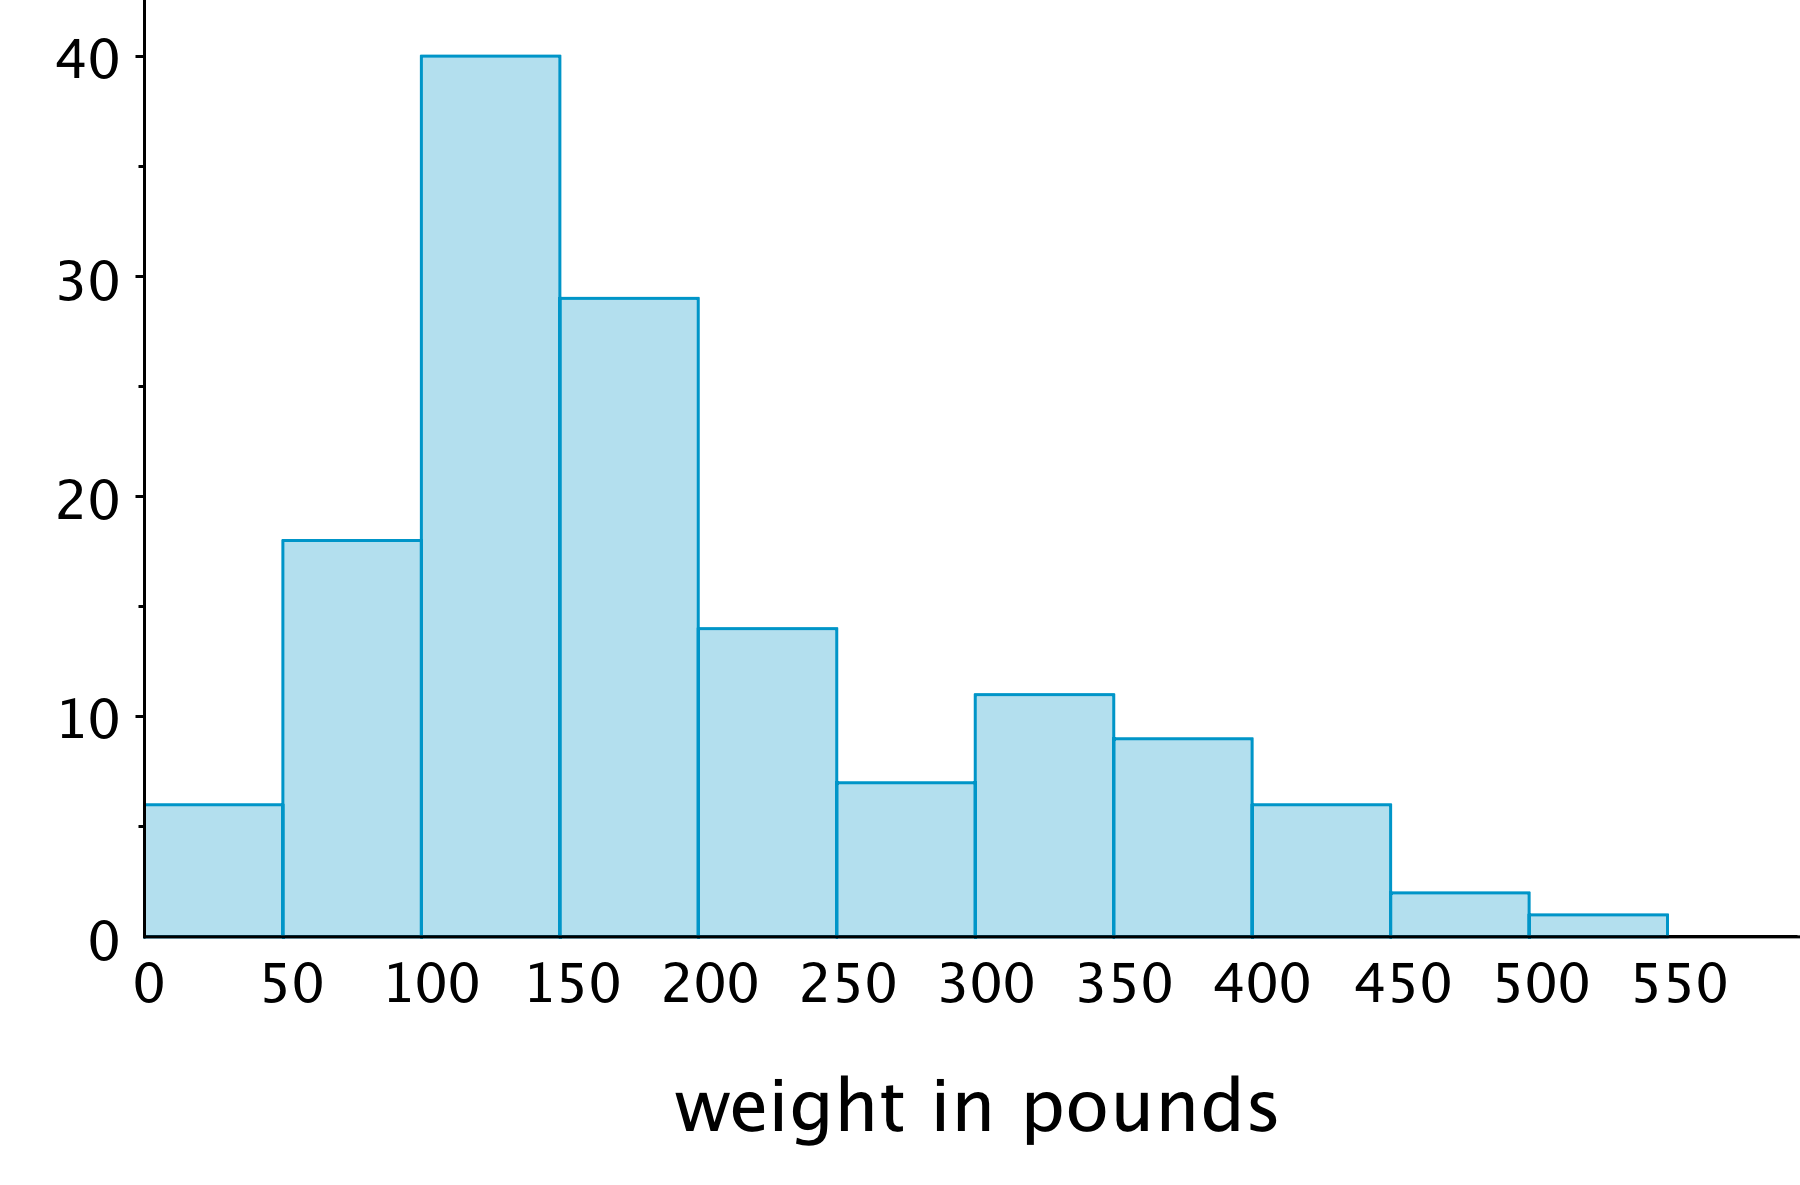
- What can you say about the heaviest bear in this group?
- What is a typical weight for the bears in this group?
- Do more than half of the bears in this group weigh less than 250 pounds?
- If weight is related to age, with older bears tending to have greater body weights, would you say that there were more old bears or more young bears in the group? Explain your reasoning.
Lesson 14
Problem 1
Here is a dot plot that shows the ages of teachers at a school.
Which of these statements is true of the data set shown in the dot plot?

- The mean is less than the median.
- The mean is approximately equal to the median.
- The mean is greater than the median.
- The mean cannot be determined.
Problem 2
Priya asked each of five friends to attempt to throw a ball in a trash can until they succeeded. She recorded the number of unsuccessful attempts made by each friend as: 1, 8, 6, 2, 4. Priya made a mistake: The 8 in the data set should have been 18.
How would changing the 8 to 18 affect the mean and median of the data set?
- The mean would decrease and the median would not change.
- The mean would increase and the median would not change.
- The mean would decrease and the median would increase.
- The mean would increase and the median would increase.
Problem 3
In his history class, Han's homework scores are:
| 100 | 100 | 100 | 100 | 95 | 100 | 90 | 100 | 0 |
The history teacher uses the mean to calculate the grade for homework. Write an argument for Han to explain why median would be a better measure to use for his homework grades.
Problem 4
The dot plots show how much time, in minutes, students in a class took to complete each of five different tasks. Select all the dot plots of tasks for which the mean time is approximately equal to the median time.

Problem 5 (from Unit 8, Lesson 2)
Zookeepers recorded the ages, weights, genders, and heights of the 10 pandas at their zoo. Write two statistical questions that could be answered using these data sets.
Problem 6 (from Unit 7, Lesson 12)
Here is a set of coordinates. Draw and label an appropriate pair of axes and plot the points. $A = (1, 0)$, $B = (0, 0.5)$, $C= (4, 3.5)$, $D = (1.5, 0.5)$
Lesson 15
Problem 1
Suppose that there are 20 numbers in a data set and that they are all different.
- How many of the values in this data set are between the first quartile and the third quartile?
- How many of the values in this data set are between the first quartile and the median?
Problem 2
In a word game, 1 letter is worth 1 point. This dot plot shows the scores for 20 common words.
- What is the median score?
- What is the first quartile (Q1)?

- What is the third quartile (Q3)?
- What is the interquartile range (IQR)?
Problem 3
Here are five dot plots that show the amounts of time that ten sixth-grade students in five countries took to get to school. Match each dot plot with the appropriate median and IQR.
- Median: 17.5, IQR: 11
- Median: 15, IQR: 30
- Median: 8, IQR: 4
- Median: 7, IQR: 10
- Median: 12.5, IQR: 8
Problem 4
Mai and Priya each played 10 games of bowling and recorded the scores. Mai’s median score was 120, and her IQR was 5. Priya’s median score was 118, and her IQR was 15. Whose scores probably had less variability? Explain how you know.
Problem 5 (from Unit 7, Lesson 12)
Draw and label an appropriate pair of axes and plot the points. $A = (10, 50)$, $B = (30, 25)$, $C = (0, 30)$, $D = (20, 35)$
Problem 6 (from Unit 6, Lesson 7)
There are 20 pennies in a jar. If 16% of the coins in the jar are pennies, how many coins are there in the jar?
Lesson 16
Problem 1
Each student in a class recorded how many books they read during the summer. Here is a box plot that summarizes their data.

- What is the greatest number of books read by a student in this group?
- What is the median number of books read by the students?
- What is the interquartile range (IQR)?
Problem 2
Use this five-number summary to draw a box plot. All values are in seconds.
- Minimum: 40
- First quartile (Q1): 45
- Median: 48
- Third quartile (Q3): 50
- Maximum: 60
Problem 3
The table shows the number of hours per week that each of 13 seventh-grade students spent doing homework. Create a box plot to summarize the data.
| 3 | 10 | 12 | 4 | 7 | 9 | 5 | 5 | 11 | 11 | 5 | 12 | 11 |
Problem 4
The box plot displays the data on the response times of 100 mice to seeing a flash of light. How many mice are represented by the rectangle between 0.5 and 1 second?

Problem 5 (from Unit 8, Lesson 14)
Here is a dot plot that represents a data set. Explain why the mean of the data set is greater than its median.

Problem 6 (from Unit 8, Lesson 9)
Jada earns money from babysitting, walking her neighbor’s dogs, and running errands for her aunt. Every four weeks, she combines her earnings and divides them into three equal parts—one for spending, one for saving, and one for donating to a charity. Jada donated \$26.00 of her earnings from the past four weeks to charity.
How much could she have earned from each job? Make two lists of how much she could have earned from the three jobs during the past four weeks.
Lesson 17
Problem 1
Here are box plots that summarize the heights of 20 professional male athletes in basketball, football, hockey, and baseball.
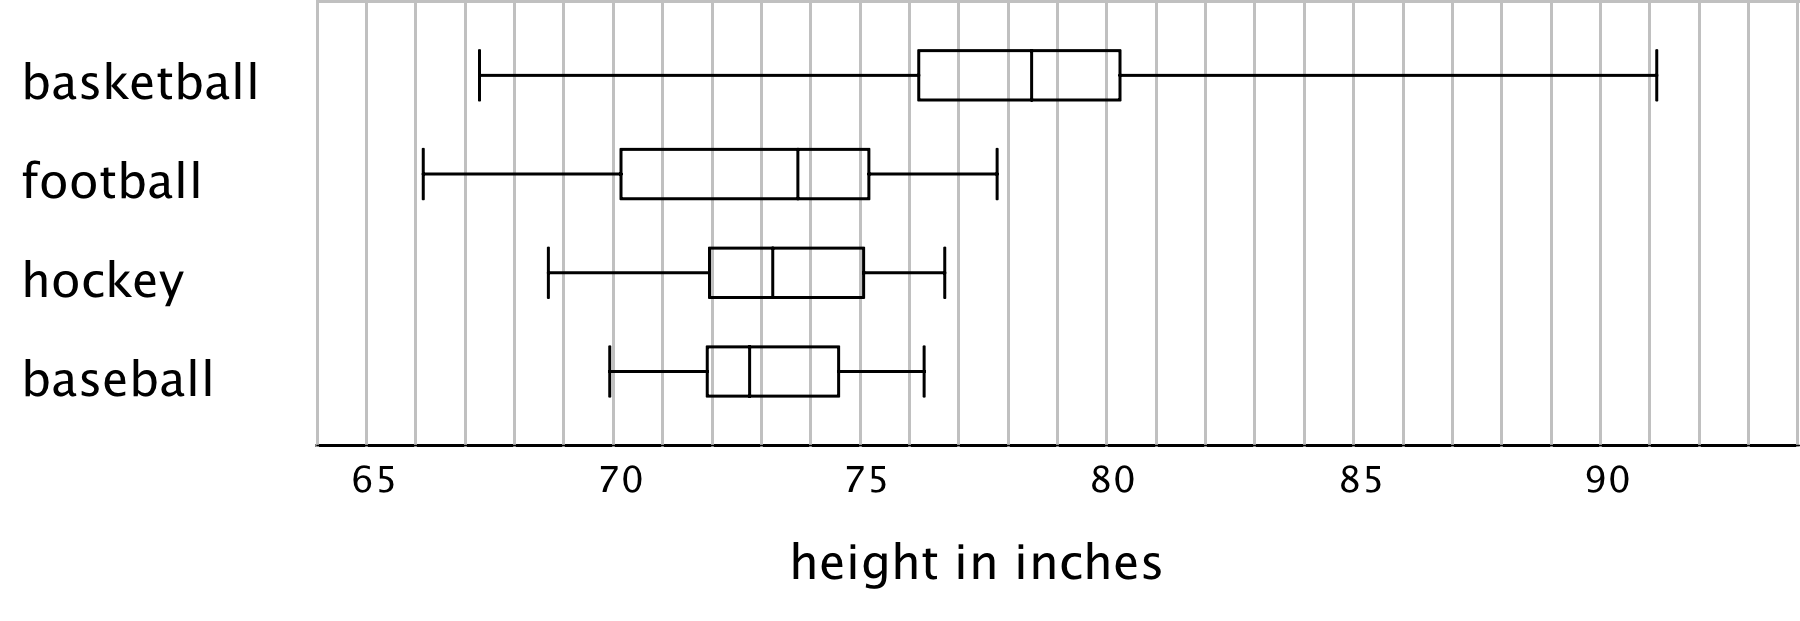
- In which two sports are the players’ height distributions most alike? Explain your reasoning.
- Which sport shows the greatest variability in players’ heights? Which sport shows the least variability?
Problem 2
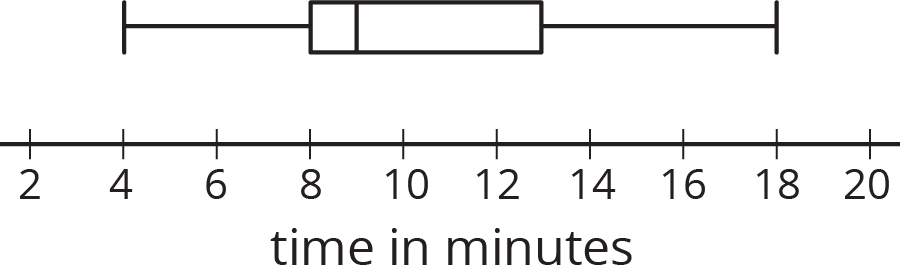
Here is a box plot that summarizes data for the time, in minutes, that a fire department took to respond to 100 emergency calls.
Select all the statements that are true, according to the dot plot.
- Most of the response times were under 13 minutes.
- Fewer than 30 of the response times were over 13 minutes.
- More than half of the response times were 11 minutes or greater.
- There were more response times that were greater than 13 minutes than those that were less than 9 minutes.
- About 75% of the response times were 13 minutes or less.
Problem 3
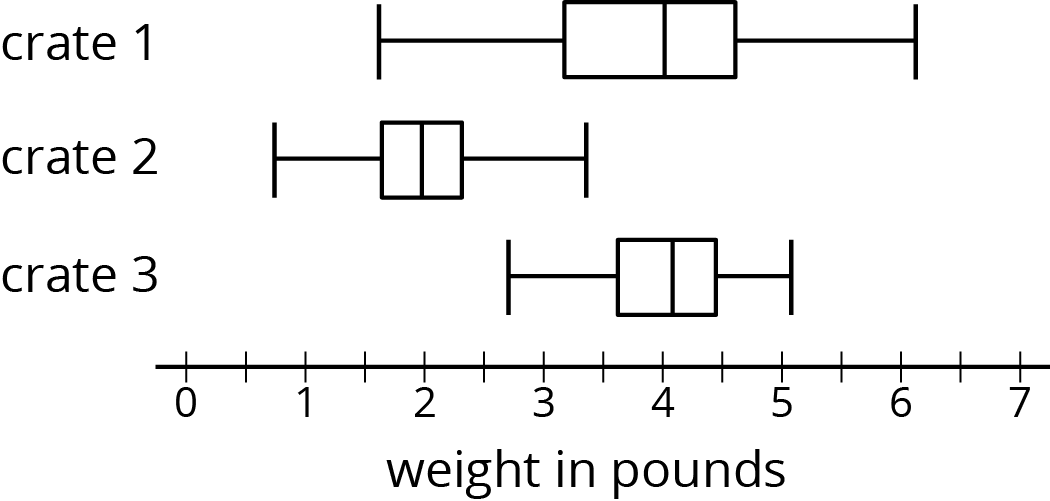
Pineapples were packed in three large crates. For each crate, the weight of every pineapple in the crate was recorded. Here are three box plots that summarize the weights in each crate.
Select all of the statements that are true, according to the box plots.
- The weights of the pineapples in Crate 1 were the most variable.
- The heaviest pineapple was in Crate 1.
- The lightest pineapple was in Crate 1.
- Crate 3 had the greatest median weight and the greatest IQR.
- More than half the pineapples in Crate 1 and Crate 3 were heavier than the heaviest pineapple in Crate 2.
Problem 4 (from Unit 8, Lesson 12)
Two TV shows each asked 100 viewers for their ages. For one show, the mean age of the viewers was 35 years and the MAD was 20 years. For the other show, the mean age of the viewers was 30 years and the MAD was 5 years.
A sixth-grade student says he watches one of the shows. Which show do you think he watches? Explain your reasoning.
Lesson 18
Problem 1
Twenty students timed how long each of them took to solve a puzzle. Here is a dot plot of their solution times.
- Predict which measure of center —the mean or the median—will be larger. Explain your reasoning.
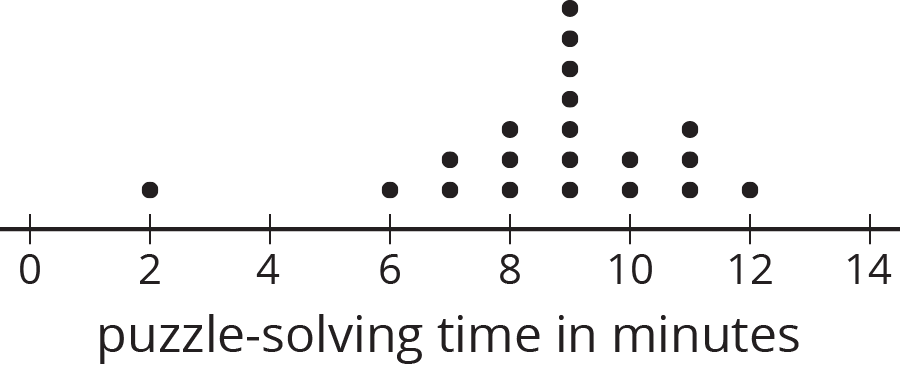
- Calculate the mean and the median. Was your prediction correct?
- Which pair of measures of center and variability—mean and MAD, or median and IQR—would you choose to describe the distribution of the solution times? Explain your reasoning.
Problem 2
A local library showed a movie during a children’s festival. Jada recorded the ages of 100 children who watched the movie. Here is a histogram for her data.
Answer each question. Explain your reasoning for each answer.
- Can the histogram be used to estimate the mean age of the movie watchers?
- Can the histogram be used to estimate the median age of the movie watchers?
- Can the histogram be used to find the exact median age of the movie watchers?
- Is it possible to tell from the histogram if there was at least one 3-year-old who watched the movie?
Problem 3 (from Unit 8, Lesson 5)
In a game, players are shown a picture that has 14 butterfly shapes hidden in it. They are given 3 minutes to find as many hidden butterfly shapes as they can.
Twenty fourth-grade students and twenty sixth-grade students played this game. The dot plots represent the numbers of butterfly shapes the two groups found.

Write a few sentences comparing the numbers of hidden butterflies found for these two groups of students.
Problem 4 (from Unit 8, Lesson 15)
In a round of mini-golf, Elena records the number of strokes it takes to hit the ball in the hole for each green. Find the range, median, and interquartile range for the number of strokes needed on each green.
| 2 | 3 | 1 | 4 | 5 | 2 | 3 | 4 | 3 |