13.1: Number Talk: Division by Powers of 10
Find the value of each quotient mentally.
$34,\!000\div10$
$340\div100$
$34\div10$
$3.4\div100$
Let’s see what makes a good sample.
Find the value of each quotient mentally.
$34,\!000\div10$
$340\div100$
$34\div10$
$3.4\div100$
Your teacher will assign you to work with either means or medians.
A young artist has sold 10 paintings. Calculate the measure of center you were assigned for each of these samples:
| \$50 | \$200 | \$250 | \$275 | \$280 | \$350 | \$375 | \$400 | \$410 | \$1,200 |
The price per pound of catfish at a fish market was recorded for 100 weeks.
When doing a statistical study, it is important to keep the goal of the study in mind. Representative samples give us the best information about the distribution of the population as a whole, but sometimes a representative sample won't work for the goal of a study!
For example, suppose you want to study how discrimination affects people in your town. Surveying a representative sample of people in your town would give information about how the population generally feels, but might miss some smaller groups. Describe a way you might choose a sample of people to address this question.
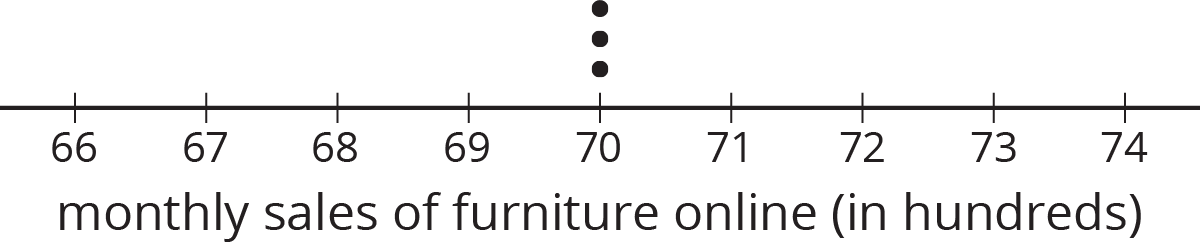
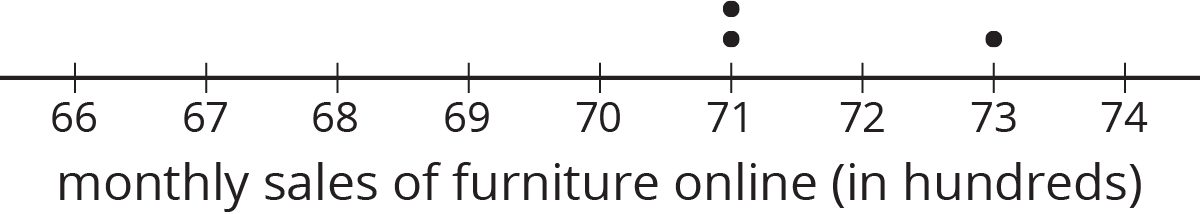
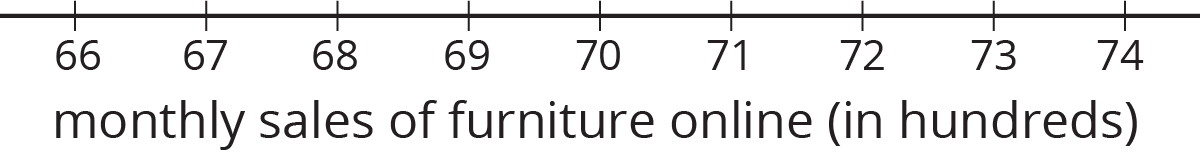
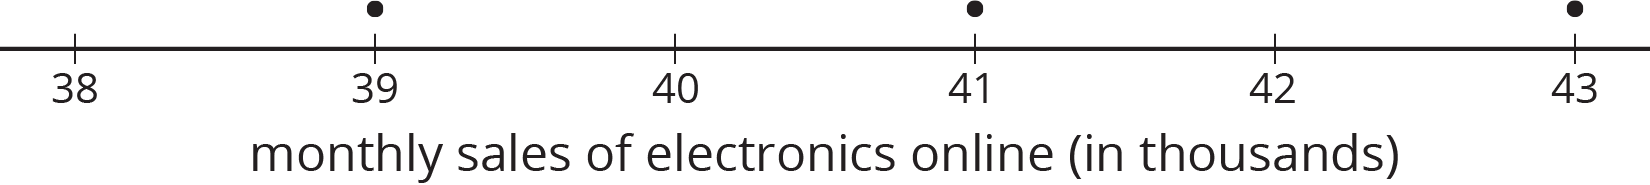
An online shopping company tracks how many items they sell in different categories during each month for a year. Three different auditors each take samples from that data. Use the samples to draw dot plots of what the population data might look like for the furniture and electronics categories.
Auditor 1's sample
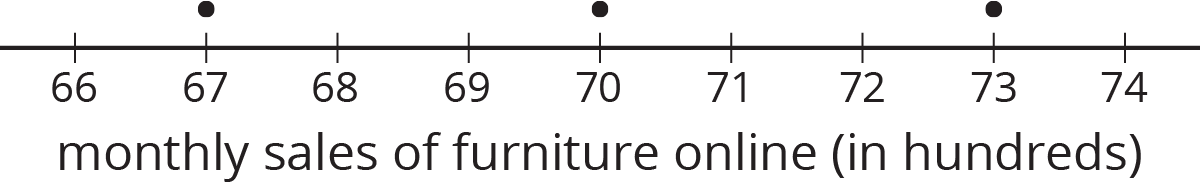
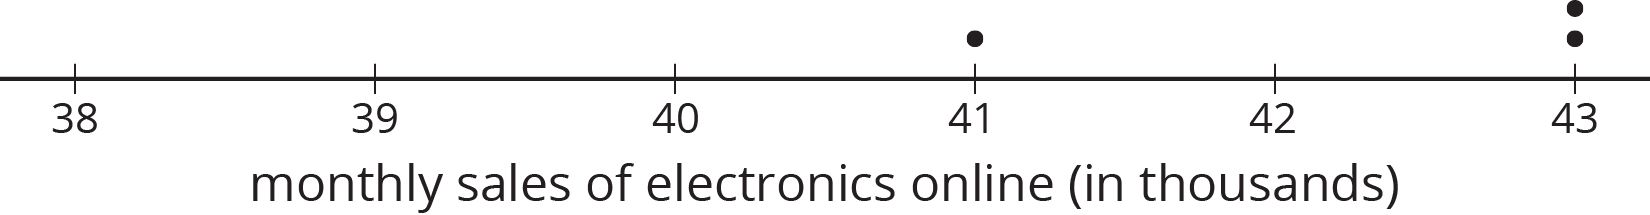
Auditor 2's sample
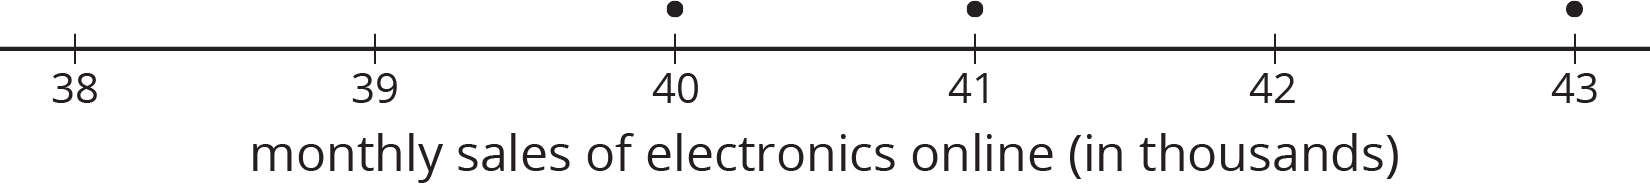
Auditor 3's sample
Population
Auditor 1's sample
Auditor 2's sample
Auditor 3's sample
Population

A sample that is representative of a population has a distribution that closely resembles the distribution of the population in shape, center, and spread.
For example, consider the distribution of plant heights, in cm, for a population of plants shown in this dot plot. The mean for this population is 4.9 cm, and the MAD is 2.6 cm.

A representative sample of this population should have a larger peak on the left and a smaller one on the right, like this one. The mean for this sample is 4.9 cm, and the MAD is 2.3 cm.

Here is the distribution for another sample from the same population. This sample has a mean of 5.7 cm and a MAD of 1.5 cm. These are both very different from the population, and the distribution has a very different shape, so it is not a representative sample.

A sample that is representative of a population has a distribution that closely resembles the distribution of the population in shape, center, and spread.