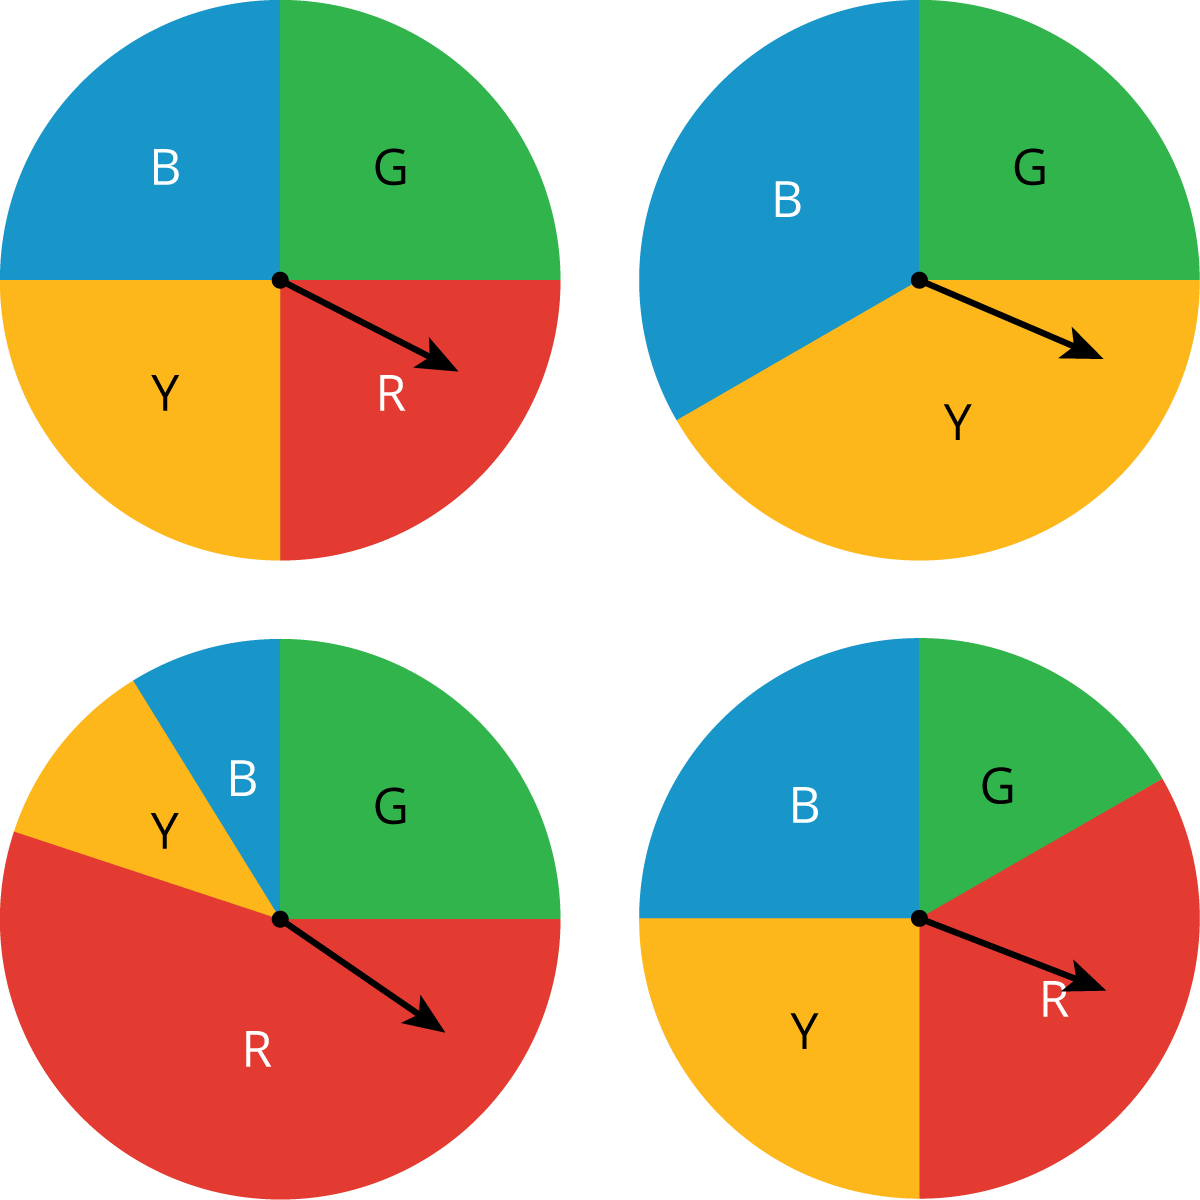
6.1: Which One Doesn’t Belong: Spinners
Which spinner doesn't belong?
Let’s simulate real-world situations.
Which spinner doesn't belong?
Your teacher will give your group the supplies for one of the three different simulations. Follow these instructions to simulate 15 days of Diego's walk. The first 3 days have been done for you.
If your group gets a bag of papers, reach into the bag, and select one paper without looking inside.
If your group gets a spinner, spin the spinner, and see where it stops.
If your group gets two number cubes, roll both cubes, and add the numbers that land face up. A sum of 2–8 means Diego has to wait.
Record in the table whether or not Diego had to wait more than 1 minute.
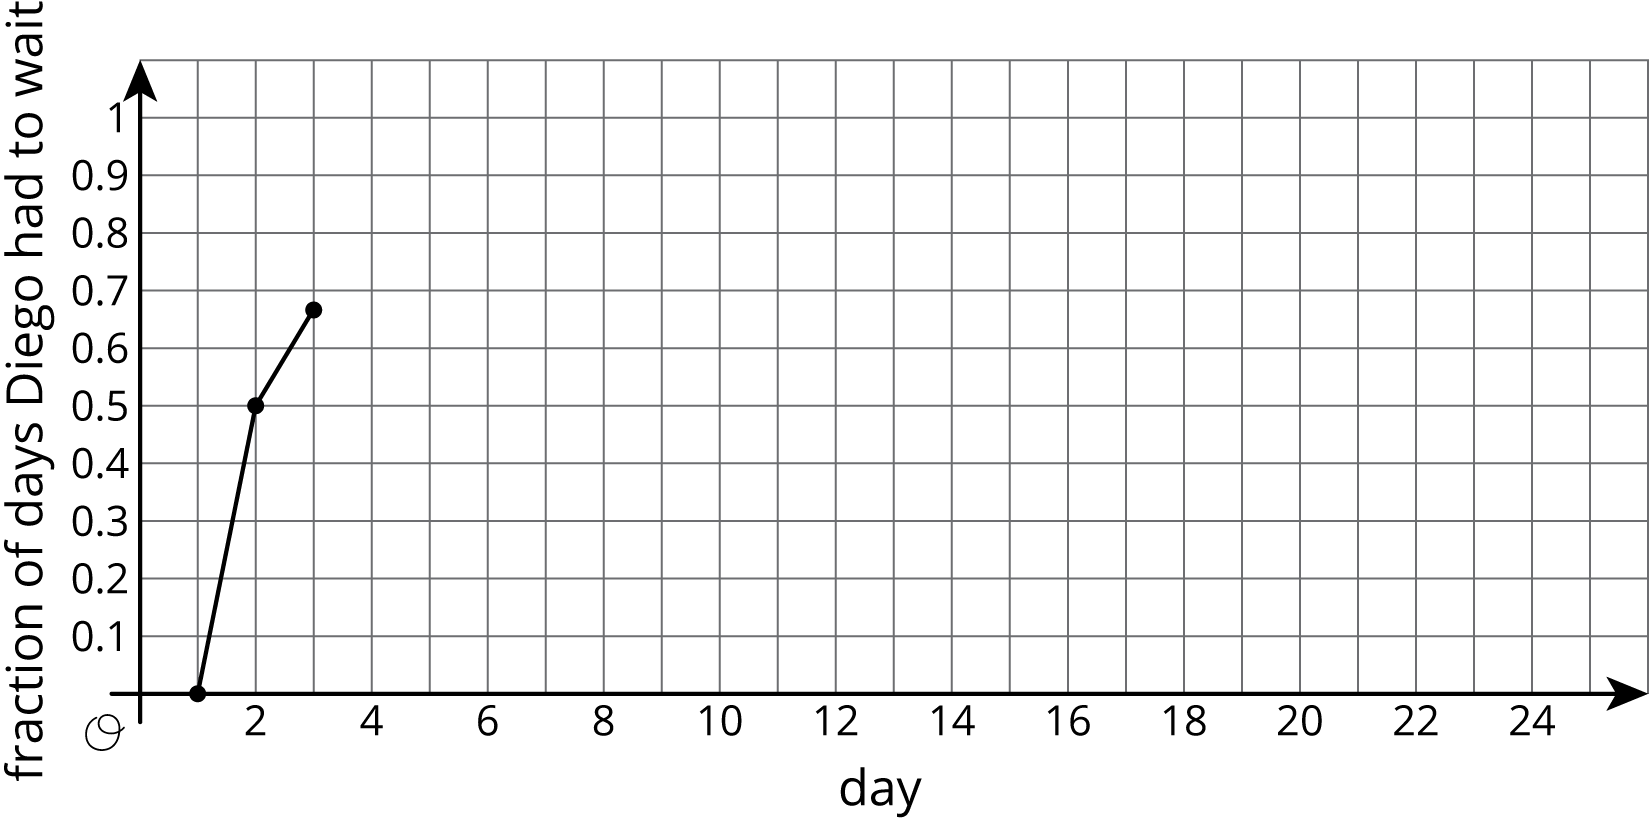
Calculate the total number of days and the cumulative fraction of days that Diego has had to wait so far.
On the graph, plot the number of days and the fraction that Diego has had to wait. Connect each point by a line.
If your group has the bag of papers, put the paper back into the bag, and shake the bag to mix up the papers.
Pass the supplies to the next person in the group.
| day | Does Diego have to wait more than 1 minute? |
total number of days Diego had to wait |
fraction of days Diego had to wait |
|
|---|---|---|---|---|
| row 1 | 1 | no | 0 | \(\frac{0}{1} =\) 0.00 |
| row 2 | 2 | yes | 1 | \(\frac{1}{2} =\) 0.50 |
| row 3 | 3 | yes | 2 | \(\frac{2}{3} \approx\) 0.67 |
| row 4 | 4 | |||
| row 5 | 5 | |||
| row 6 | 6 | |||
| row 7 | 7 | |||
| row 8 | 8 | |||
| row 9 | 9 | |||
| row 10 | 10 | |||
| row 11 | 11 | |||
| row 12 | 12 | |||
| row 13 | 13 | |||
| row 14 | 14 | |||
| row 15 | 15 |
Based on the data you have collected, do you think the fraction of days Diego has to wait after the 16th day will be closer to 0.9 or 0.7? Explain or show your reasoning.
Continue the simulation for 10 more days. Record your results in this table and on the graph from earlier.
| day | Does Diego have to wait more than 1 minute? |
total number of days Diego had to wait |
fraction of days Diego had to wait |
|
|---|---|---|---|---|
| row 1 | 16 | |||
| row 2 | 17 | |||
| row 3 | 18 | |||
| row 4 | 19 | |||
| row 5 | 20 | |||
| row 6 | 21 | |||
| row 7 | 22 | |||
| row 8 | 23 | |||
| row 9 | 24 | |||
| row 10 | 25 |
Let's look at why the values tend to not change much after doing the simulation many times.
After doing the simulation 4 times, a group finds that Diego had to wait 3 times. What is an estimate for the probability Diego has to wait based on these results?
After doing the simulation 20 times, this group finds that Diego had to wait 15 times. What is an estimate for the probability Diego has to wait based on these results?
Use these results to explain why a single result after many simulations does not affect the estimate as much as a single result after only a few simulations.
For each situation, describe a chance experiment that would fairly represent it.
Sometimes it is easier to estimate a probability by doing a simulation. A simulation is an experiment that approximates a situation in the real world. Simulations are useful when it is hard or time-consuming to gather enough information to estimate the probability of some event.
For example, imagine Andre has to transfer from one bus to another on the way to his music lesson. Most of the time he makes the transfer just fine, but sometimes the first bus is late and he misses the second bus. We could set up a simulation with slips of paper in a bag. Each paper is marked with a time when the first bus arrives at the transfer point. We select slips at random from the bag. After many trials, we calculate the fraction of the times that he missed the bus to estimate the probability that he will miss the bus on a given day.