1.1: Notice and Wonder: Two Graphs
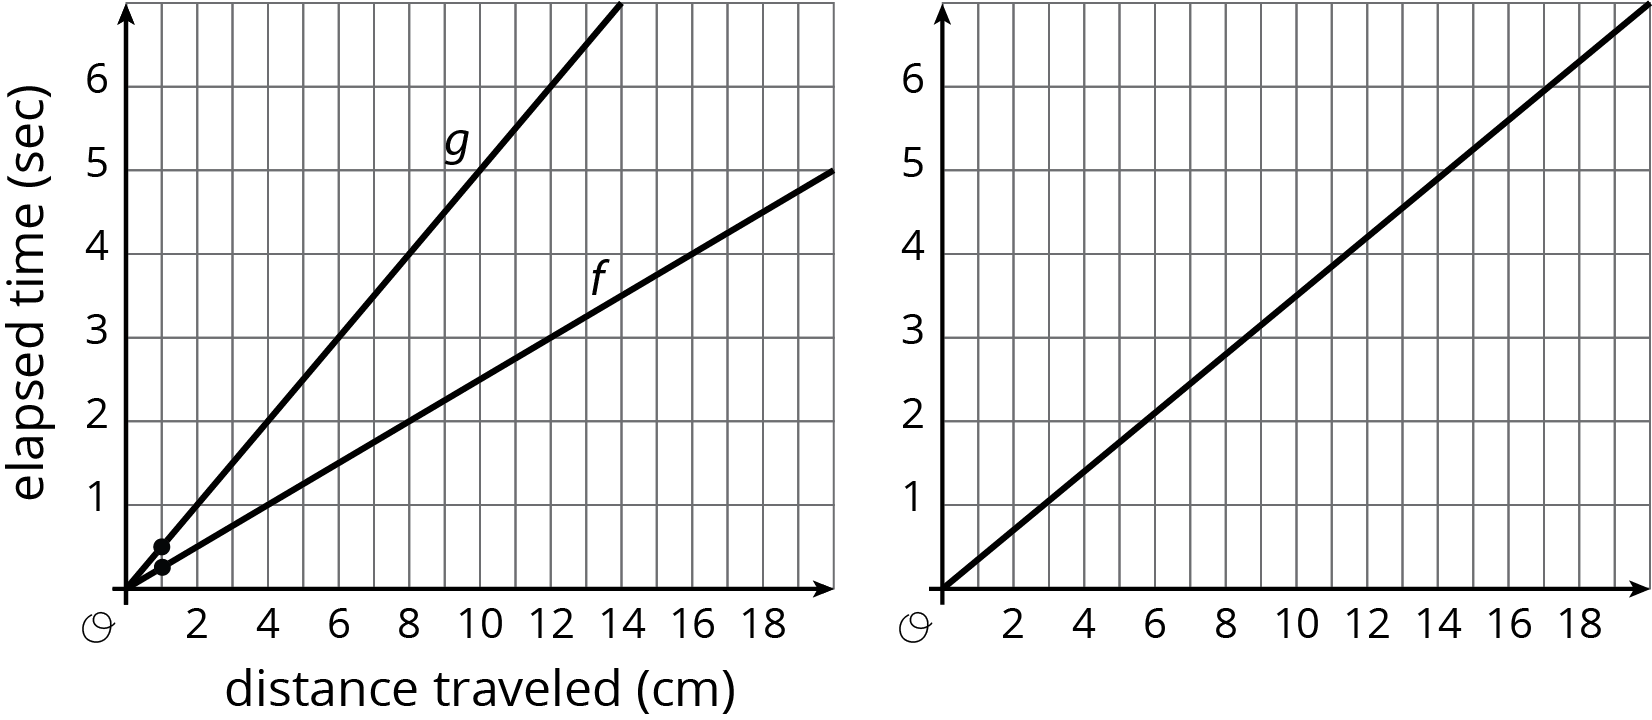
What do you notice? What do you wonder?
Let’s study some graphs.
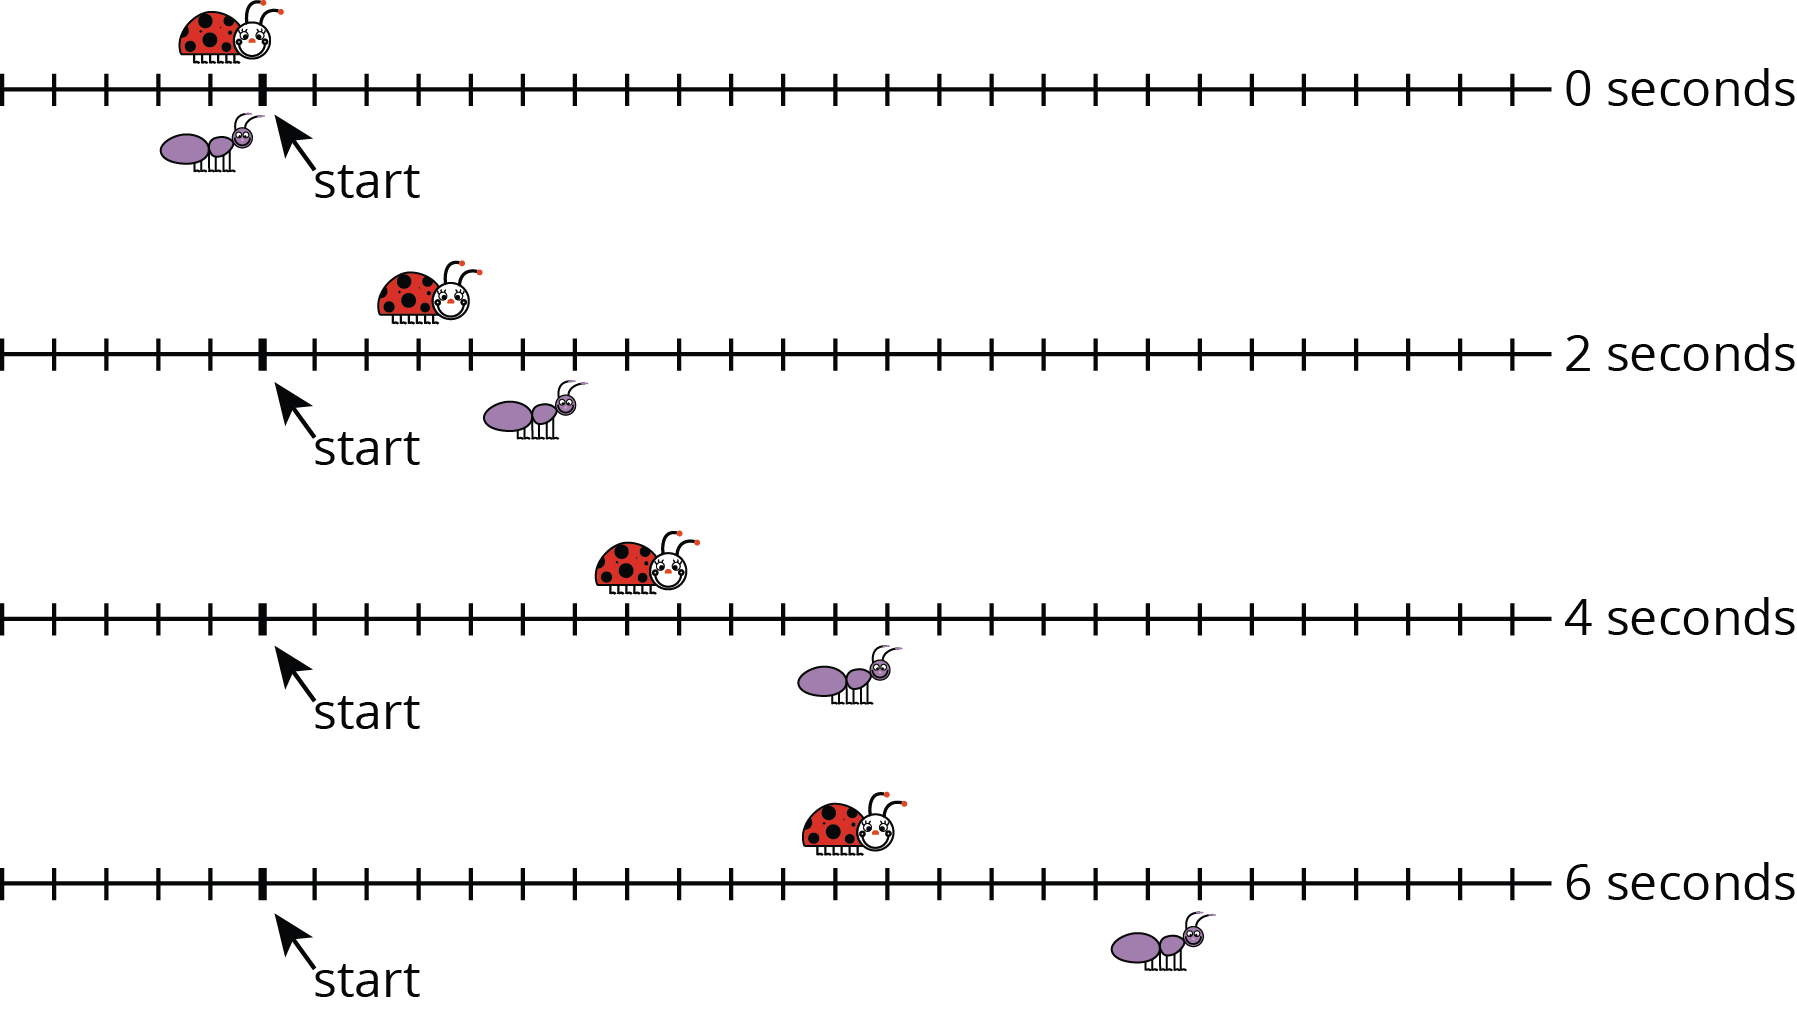
A ladybug and ant move at constant speeds. The diagrams with tick marks show their positions at different times. Each tick mark represents 1 centimeter.
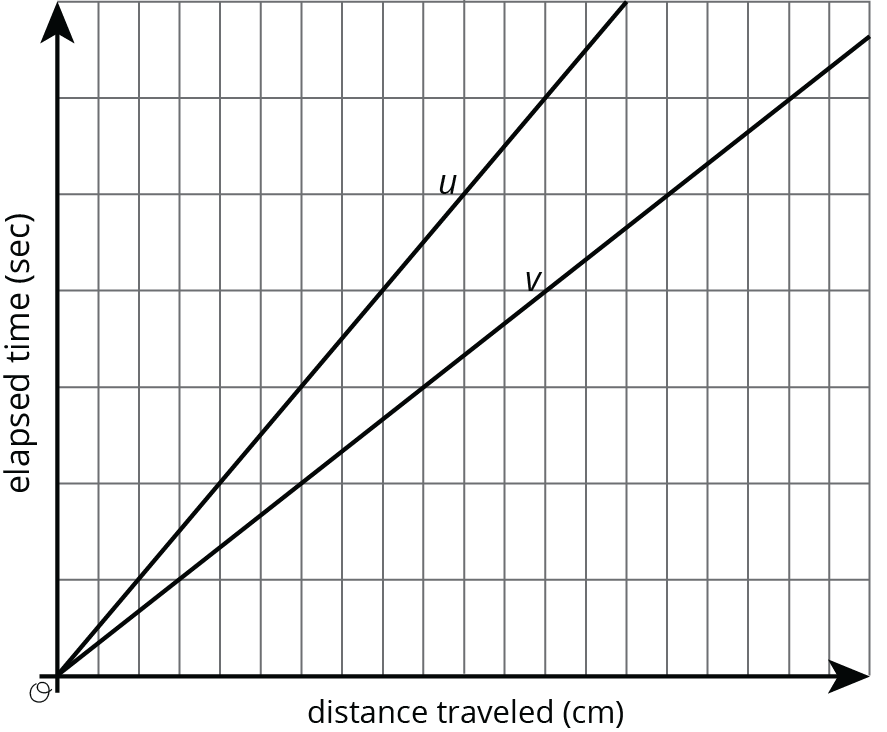
Lines $u$ and $v$ also show the positions of the two bugs. Which line shows the ladybug’s movement? Which line shows the ant’s movement? Explain your reasoning.
How long does it take the ladybug to travel 12 cm? The ant?
Scale the vertical and horizontal axes by labeling each grid line with a number. You will need to use the time and distance information shown in the tick-mark diagrams.
Mark and label the point on line $u$ and the point on line $v$ that represent the time and position of each bug after travelling 1 cm.
Refer to the tick-mark diagrams and graph in the earlier activity when needed.
Graphing is a way to help us make sense of relationships. But the graph of a line on a coordinate axes without scale or labels isn’t very helpful. For example, let’s say we know that on longer bike rides Kiran can ride 4 miles every 16 minutes and Mai can ride 4 miles every 12 minutes. Here are the graphs of these relationships:
Without labels we can’t even tell which line is Kiran and which is Mai! Without labels and a scale on the axes, we can’t use these graphs to answer questions like:
Here are the same graphs, but now with labels and scale:
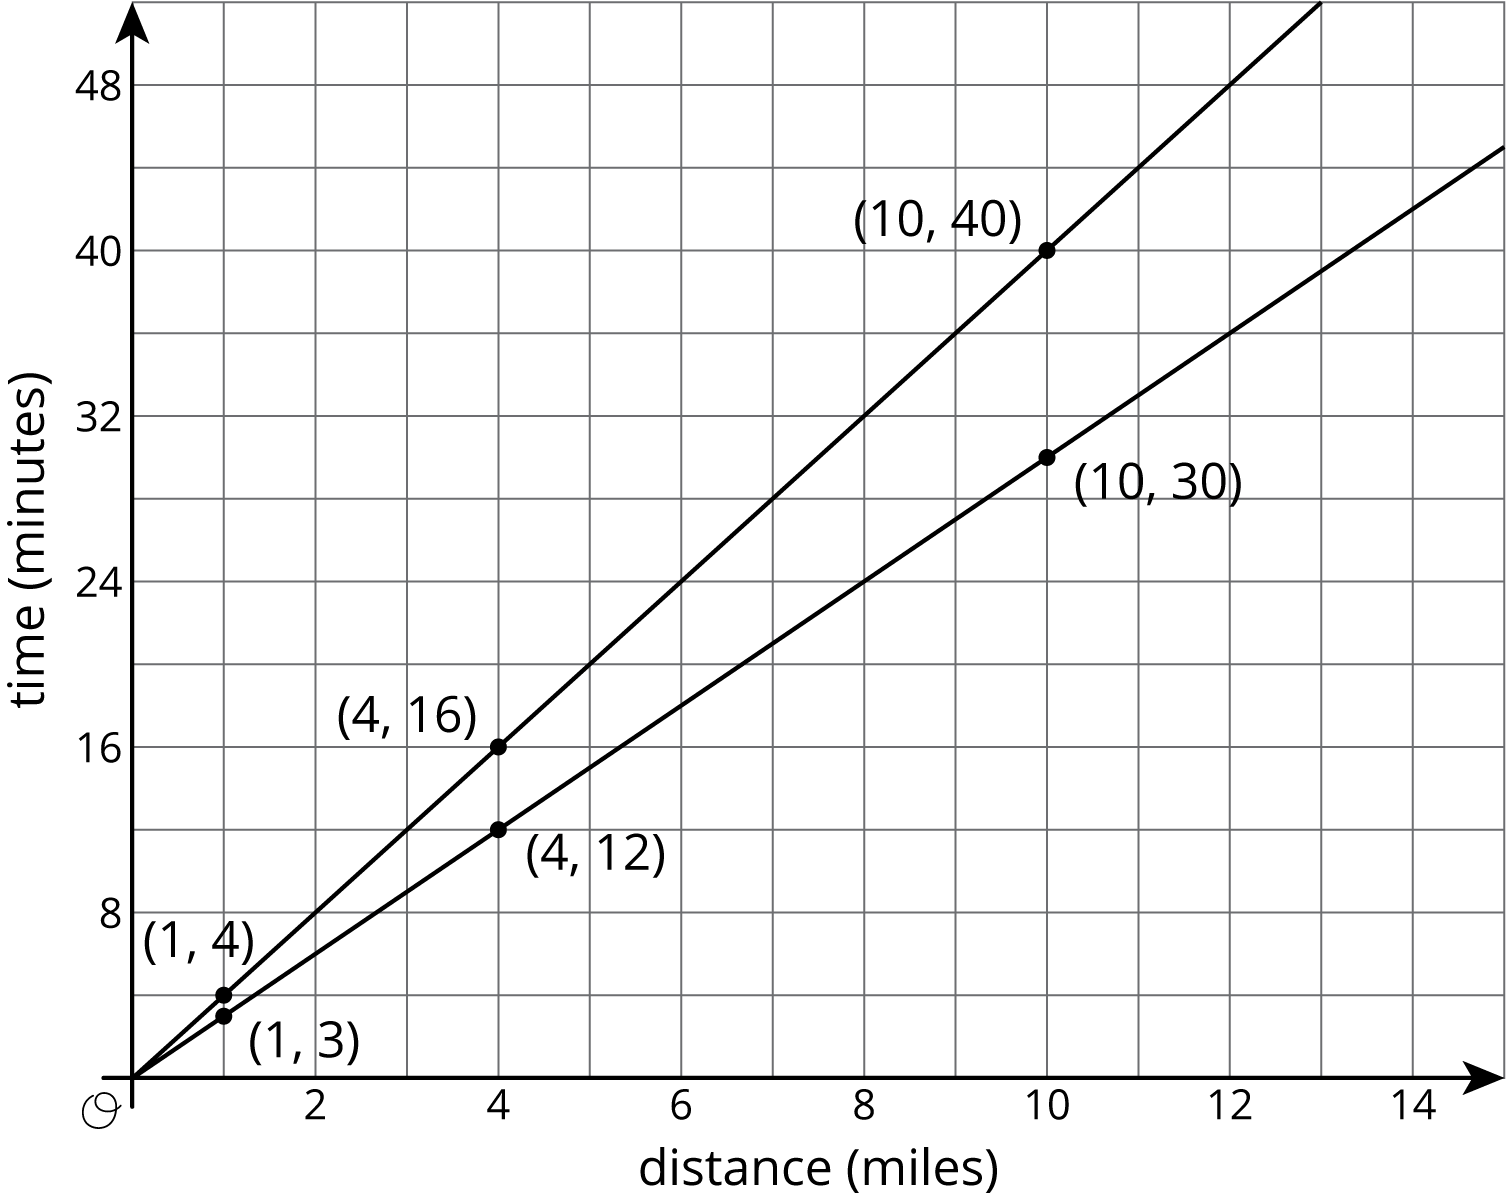
Revisiting the questions from earlier:
Which graph goes with each rider? If Kiran rides 4 miles in 16 minutes, then the point $(4,16)$ is on his graph. If he rides for 1 mile, it will take 4 minutes. 10 miles will take 40 minutes. So the upper graph represents Kiran’s ride. Mai’s points for the same distances are $(1,3)$, $(4,12)$, and $(10,30)$, so hers is the lower graph. (A letter next to each line would help us remember which is which!)
Who rides faster? Mai rides faster because she can ride the same distance as Kiran in a shorter time.
If Kiran and Mai start a bike trip at the same time, how far are they after 20 minutes? The points on the graphs at height 20 are 5 miles for Kiran and a little less than 7 miles for Mai.
How long will it take each of them to reach the end of the 12 mile bike path? The points on the graphs at a horizontal distance of 12 are 36 minutes for Mai and 48 minutes for Kiran. (Kiran’s time after 12 miles is almost off the grid!)