2.1: An Unknown Situation
Here is a graph that could represent a variety of different situations.
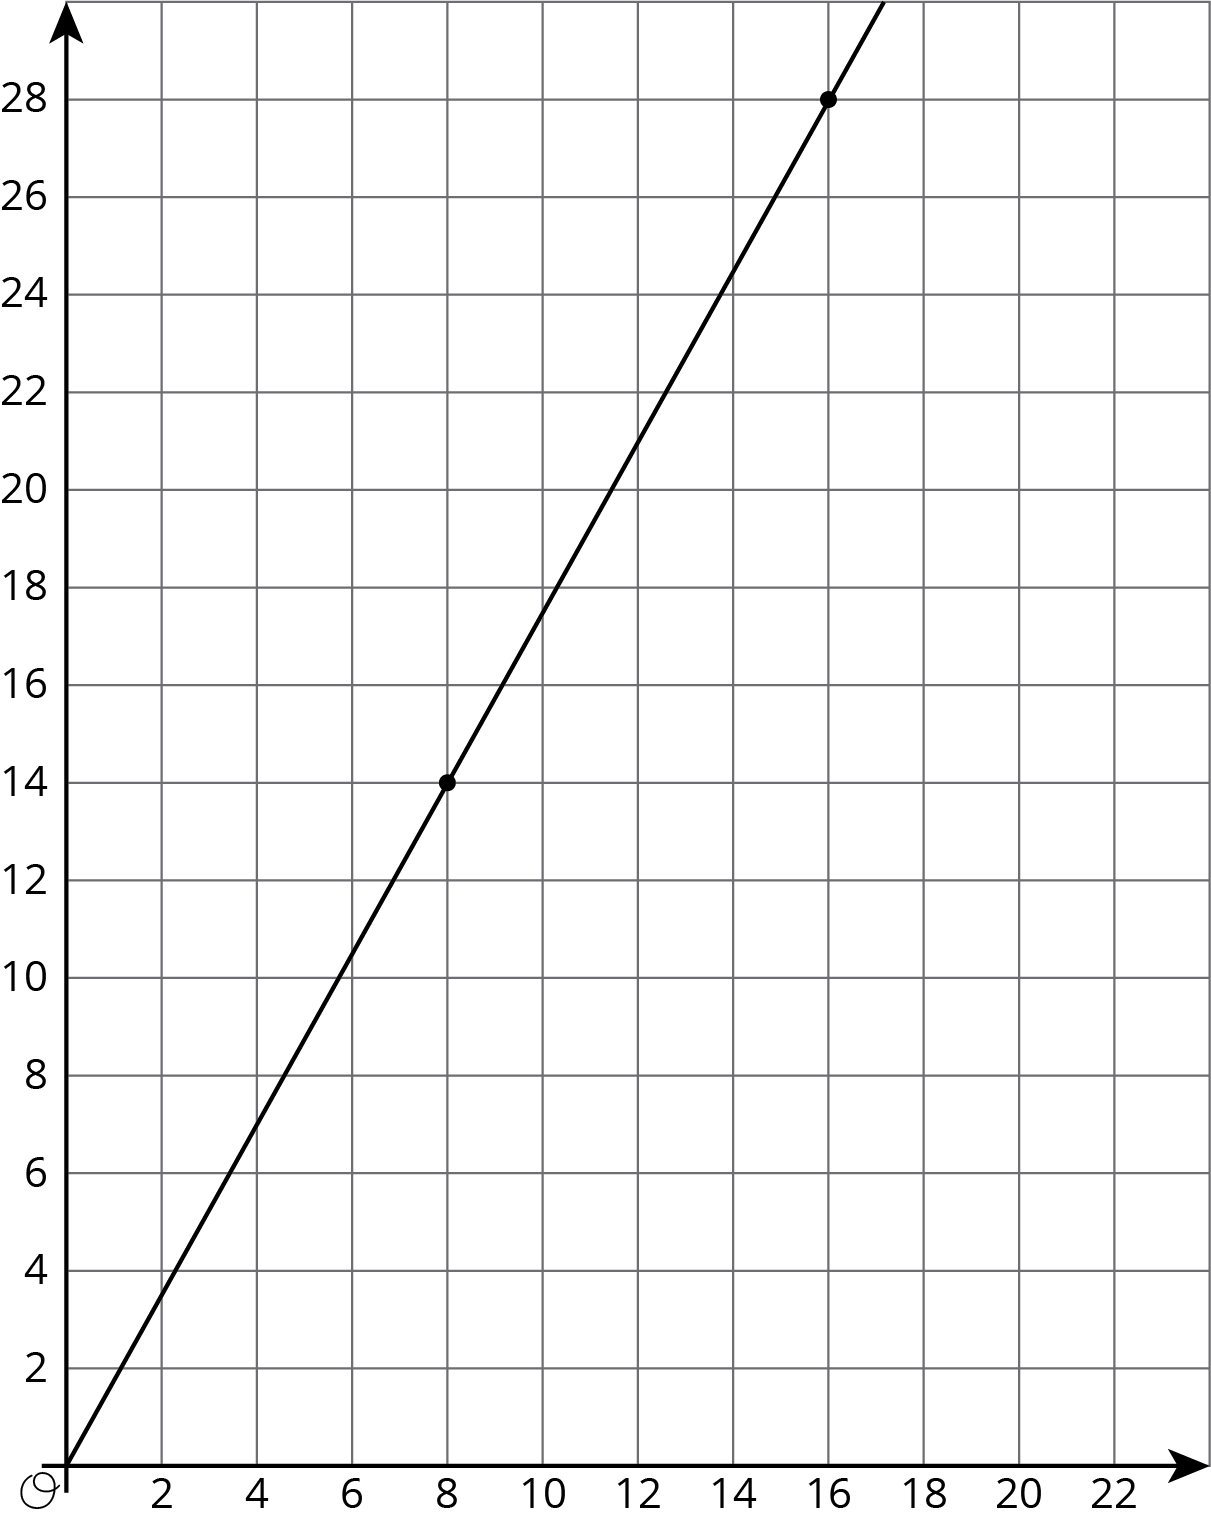
- Write an equation for the graph.
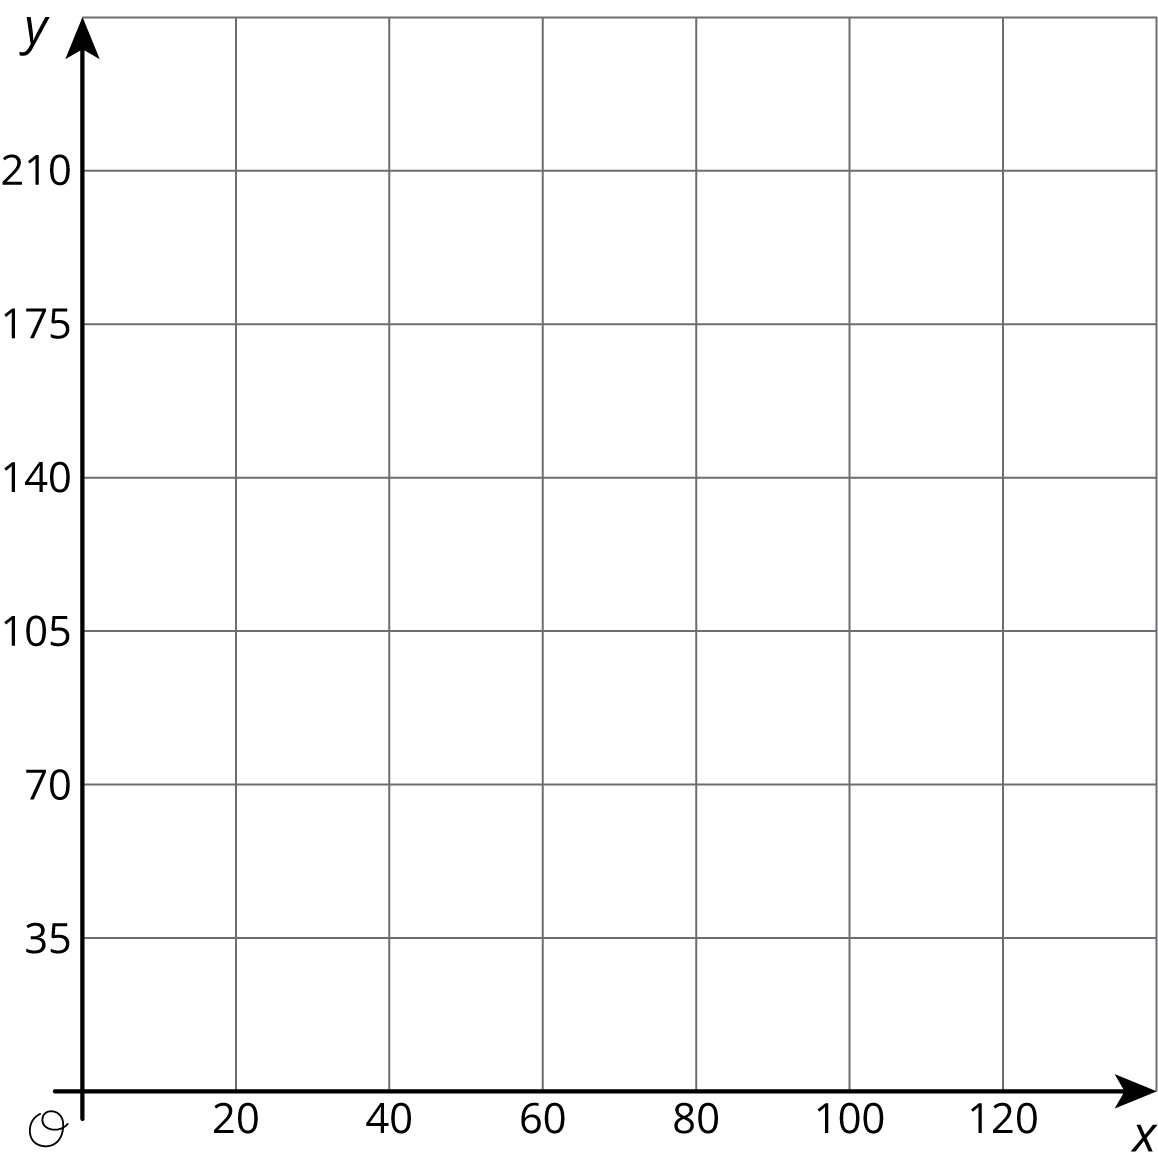
- Sketch a new graph of this relationship.
Let's think about scale.
Here is a graph that could represent a variety of different situations.
You teacher will give you 12 graphs of proportional relationships.
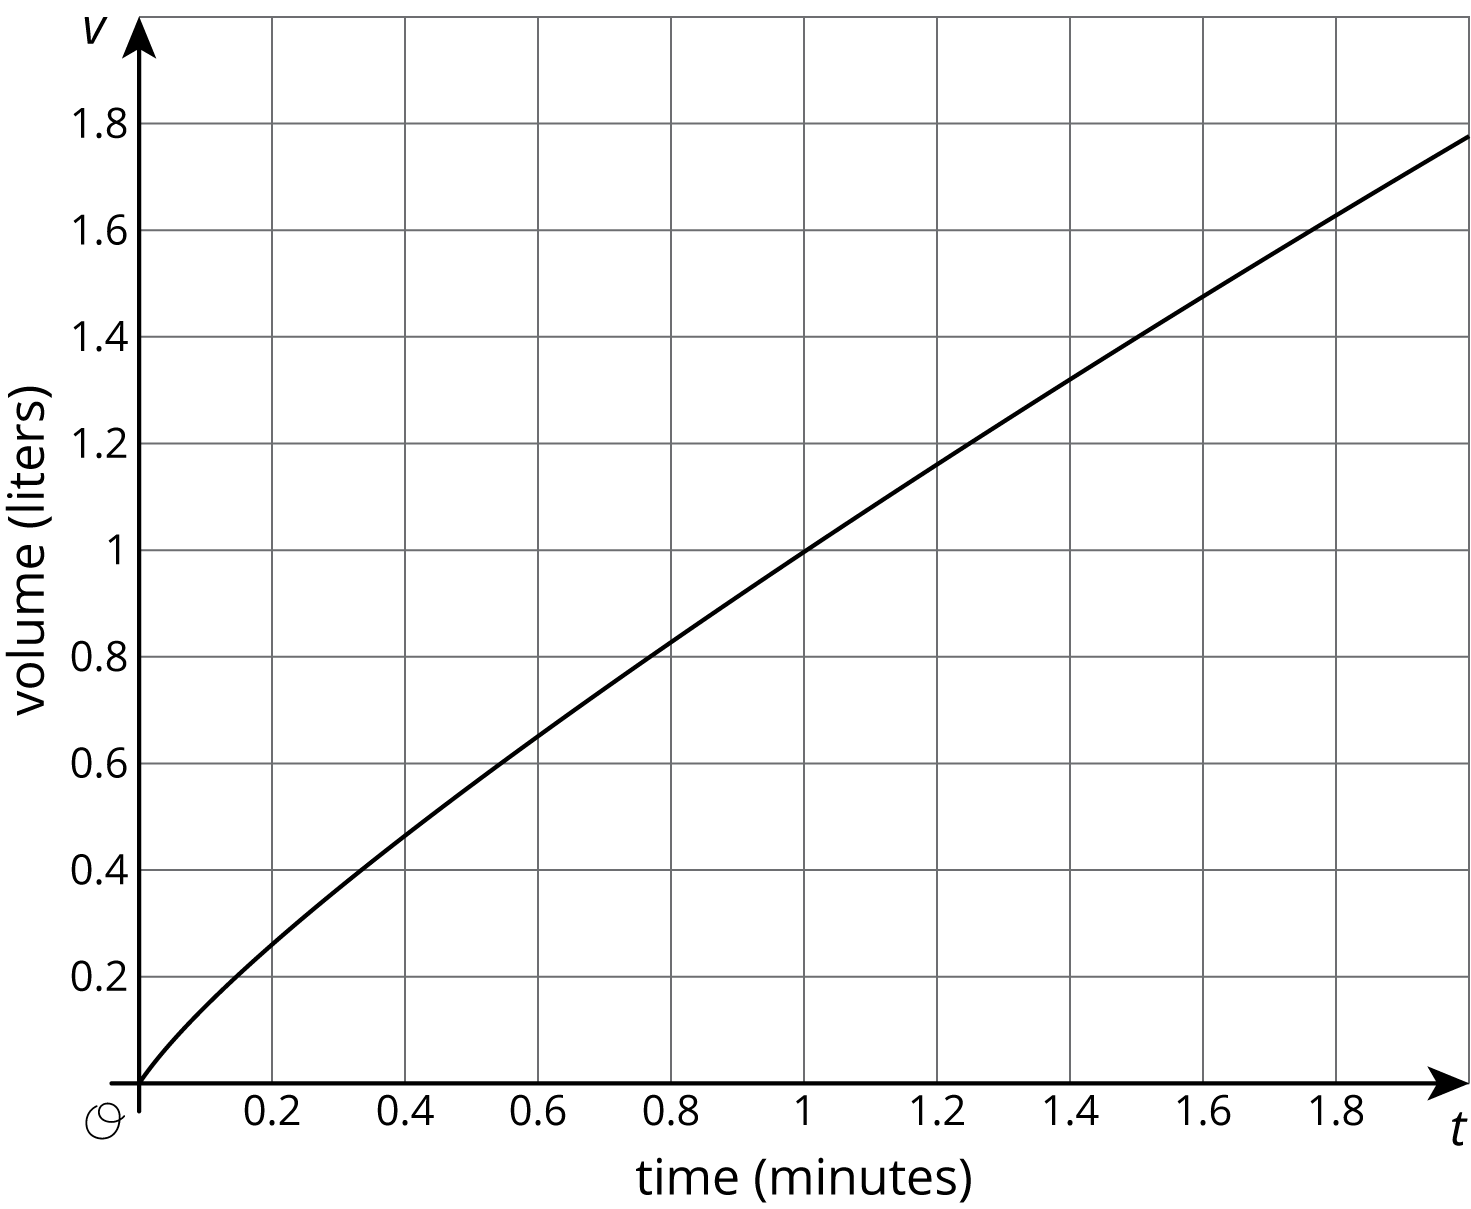
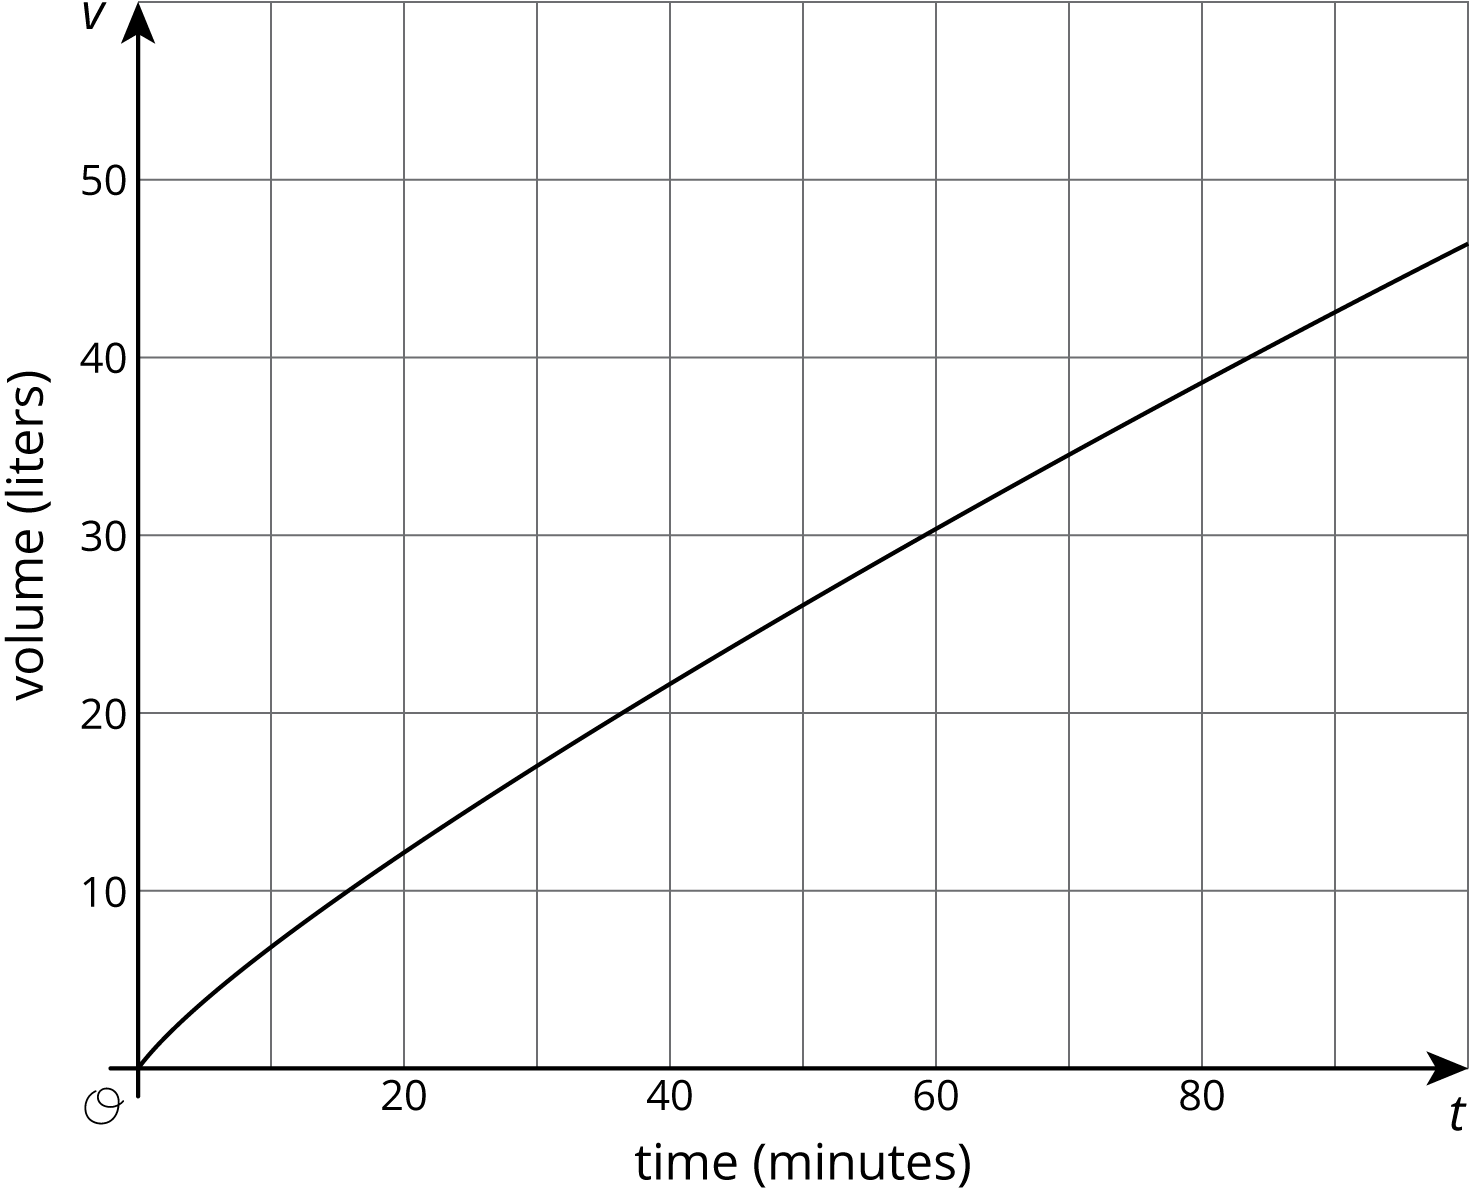
Two large water tanks are filling with water. Tank A is not filled at a constant rate, and the relationship between its volume of water and time is graphed on each set of axes. Tank B is filled at a constant rate of $\frac12$ liters per minute. The relationship between its volume of water and time can be described by the equation $v=\frac12t$, where $t$ is the time in minutes and $v$ is the total volume in liters of water in the tank.
A giant tortoise travels at 0.17 miles per hour and an arctic hare travels at 37 miles per hour.
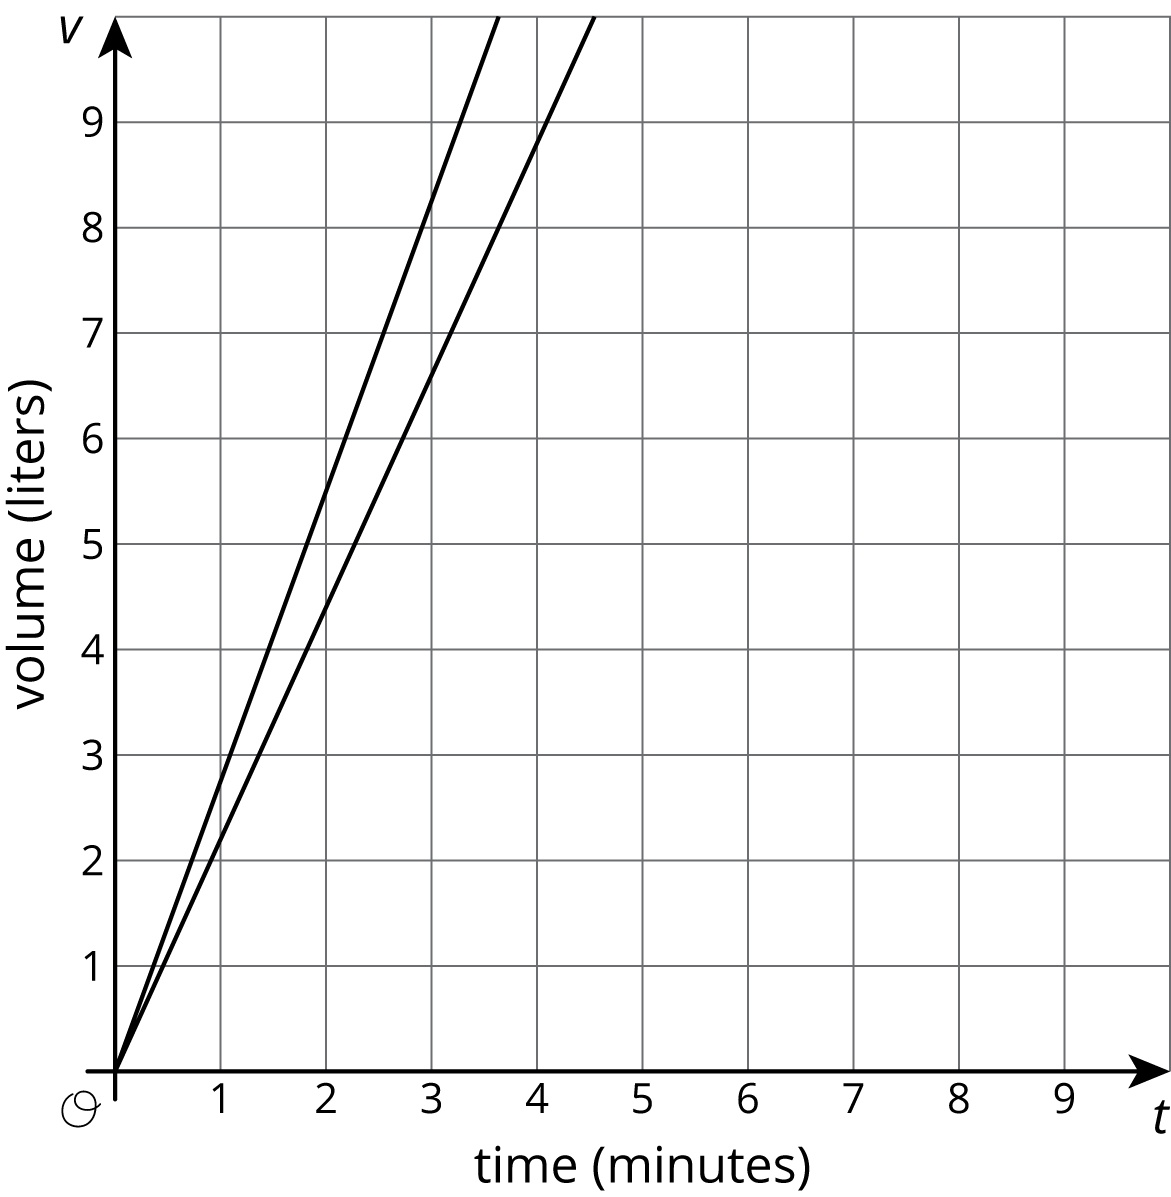
The scales we choose when graphing a relationship often depend on what information we want to know. For example, say two water tanks are filled at different constant rates. The relationship between time in minutes $t$ and volume in liters $v$ of tank A is given by $v=2.2t$. For tank B the relationship is $v=2.75t$.
These equations tell us that tank A is being filled at a constant rate of 2.2 liters per minute and tank B is being filled at a constant rate of 2.75 liters per minute.
If we want to use graphs to see at what times the two tanks will have 110 liters of water, then using an axis scale from 0 to 10, as shown here, isn't very helpful.
If we use a vertical scale that goes to 150 liters, a bit beyond the 110 we are looking for, and a horizontal scale that goes to 100 minutes, we get a much more useful set of axes for answering our question.
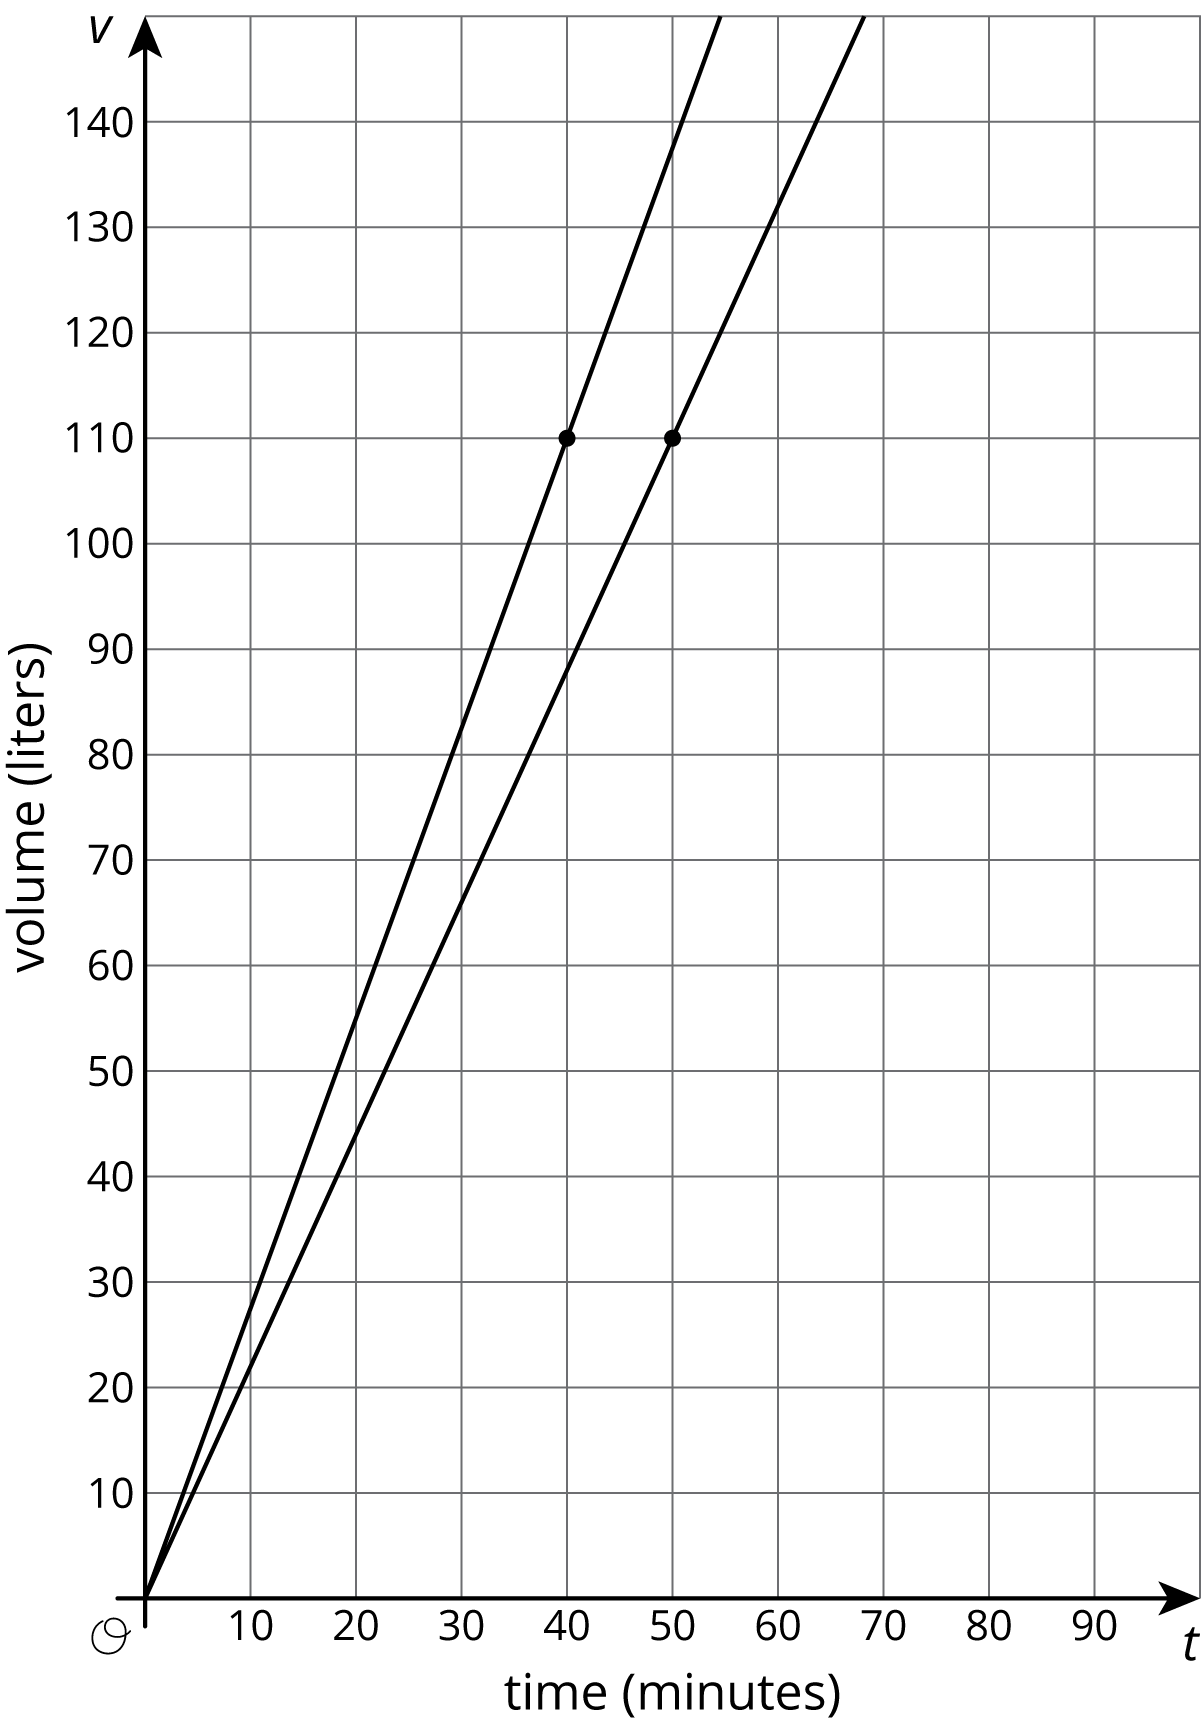
Now we can see that the two tanks will reach 110 liters 10 minutes apart—tank B after 40 minutes of filling and tank A after 50 minutes of filling.
It is important to note that both of these graphs are correct, but one uses a range of values that helps answer the question. In order to always pick a helpful scale, we should consider the situation and the questions asked about it.