5.1: Number Talk: Fraction Division
Find the value of $2\frac58 \div \frac12$.
Let’s explore some relationships between two variables.
Find the value of $2\frac58 \div \frac12$.
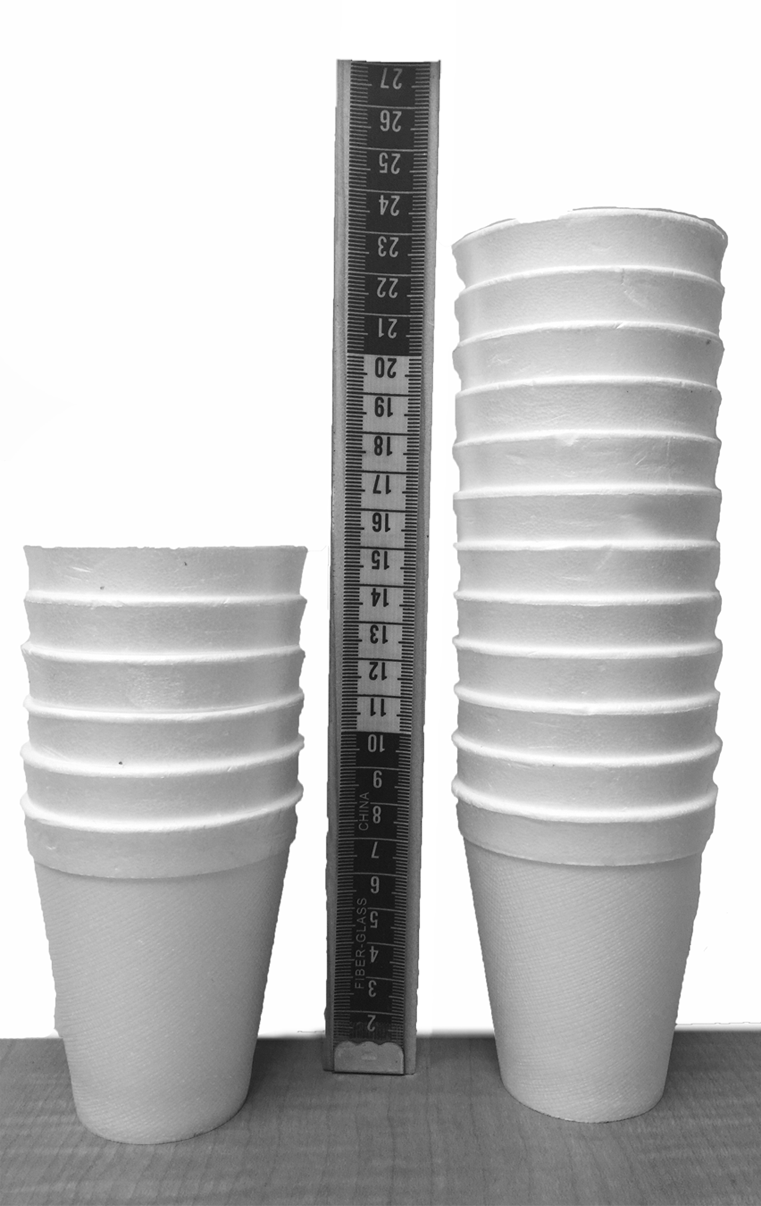
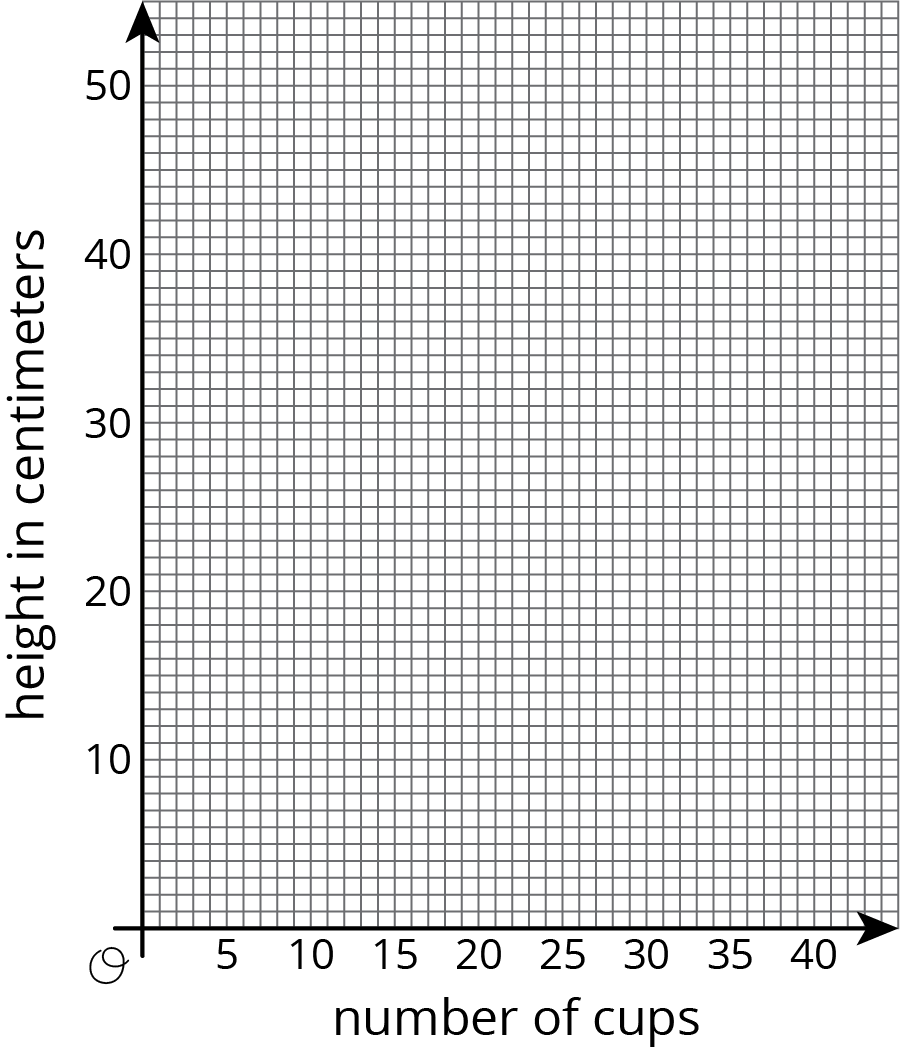
We have two stacks of styrofoam cups. One stack has 6 cups, and its height is 15 cm. The other one has 12 cups, and its height is 23 cm. How many cups are needed for a stack with a height of 50 cm?
Andre starts babysitting and charges \$10 for traveling to and from the job, and \$15 per hour. For every additional hour he works he charges another \$15. If we graph Andre's earnings based on how long he works, we have a line that starts at \$10 on the vertical axis and then increases by \$15 each hour. A linear relationship is any relationship between two quantities where one quantity has a constant rate of change with respect to the other.
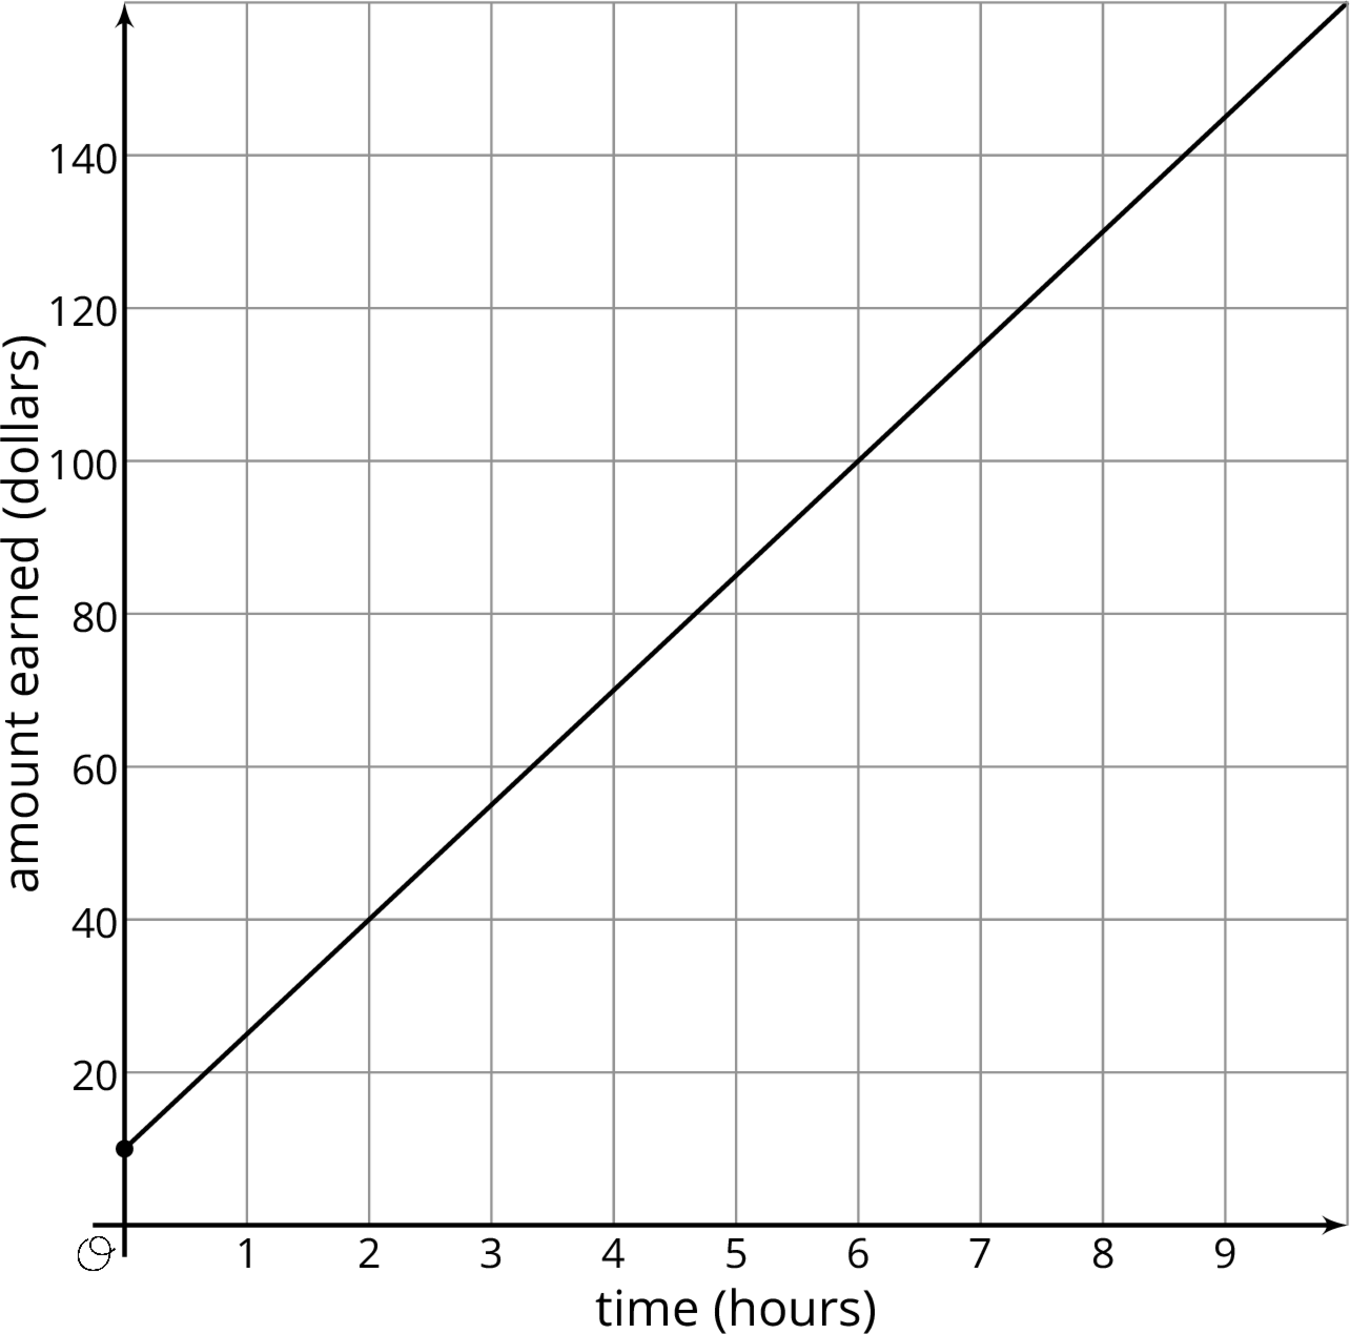
We can figure out the rate of change using the graph. Because the rate of change is constant, we can take any two points on the graph and divide the amount of vertical change by the amount of horizontal change. For example, take the points $(2, 40)$ and $(6, 100)$. They mean that Andre earns \$40 for working 2 hours and \$100 for working 6 hours. The rate of change is $\frac{100-40}{6-2} = 15$ dollars per hour. Andre's earnings go up \$15 for each hour of babysitting. Notice that this is the same way we calculate the slope of the line. That's why the graph is a line, and why we call this a linear relationship. The rate of change of a linear relationship is the same as the slope of its graph.
With proportional relationships we are used to graphs that contain the point $(0,0)$. But proportional relationships are just one type of linear relationship. In the following lessons, we will continue to explore the other type of linear relationship where the quantities are not both 0 at the same time.
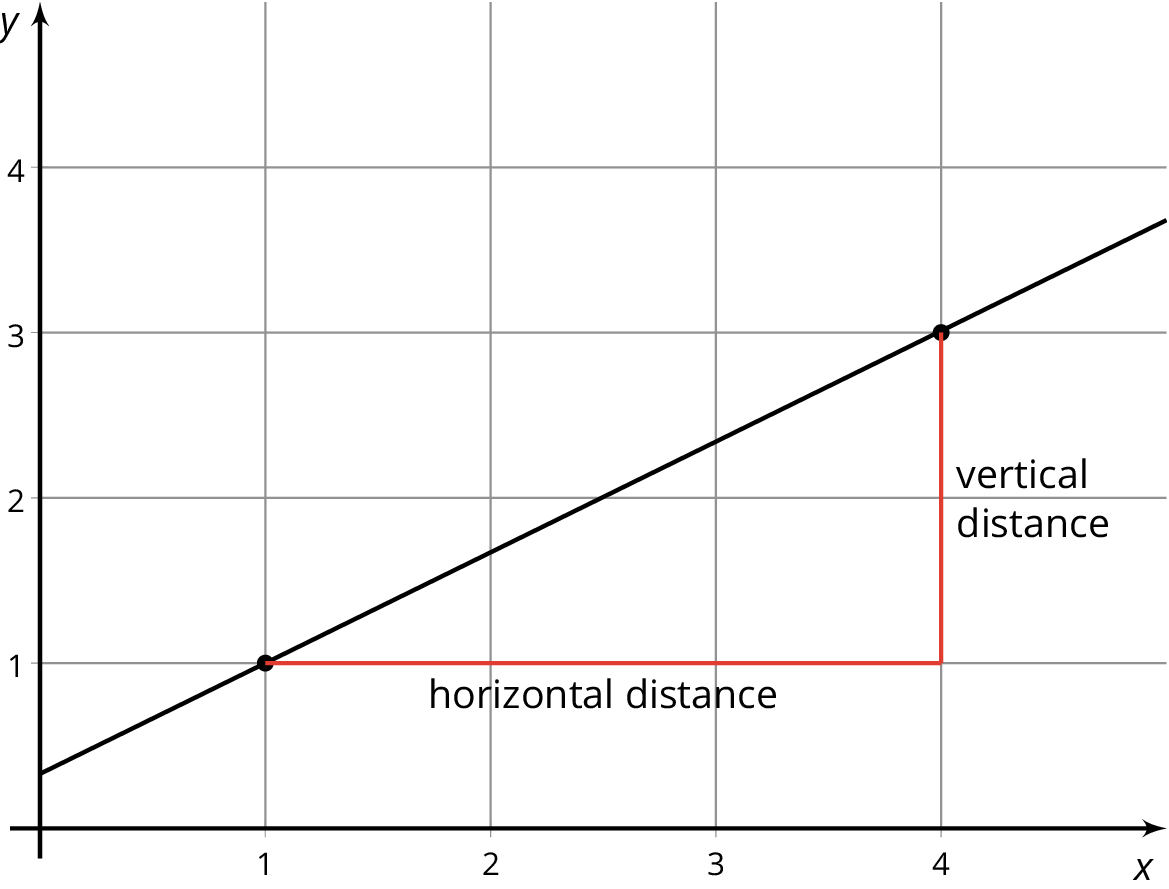
The slope of a line is the quotient of the vertical distance and the horizontal distance between any two points on the line.
In a linear relationship between two quantities $x$ and $y$, with equation $y = mx + b$, the constant $m$ is the rate of change. It tells you how much $y$ changes when $x$ changes by 1. It is also the slope of the graph of the relationship.
A linear relationship is a relationship between two quantities where one quantity has a constant rate of change with respect to the other. The relationship is called linear because its graph is a line. A linear relationship can be represented by an equation of the form $y = mx + b$, where $m$ and $b$ are constants.