Lesson 6: More Linear Relationships

Let’s explore some more relationships between two variables.

6.1: Growing

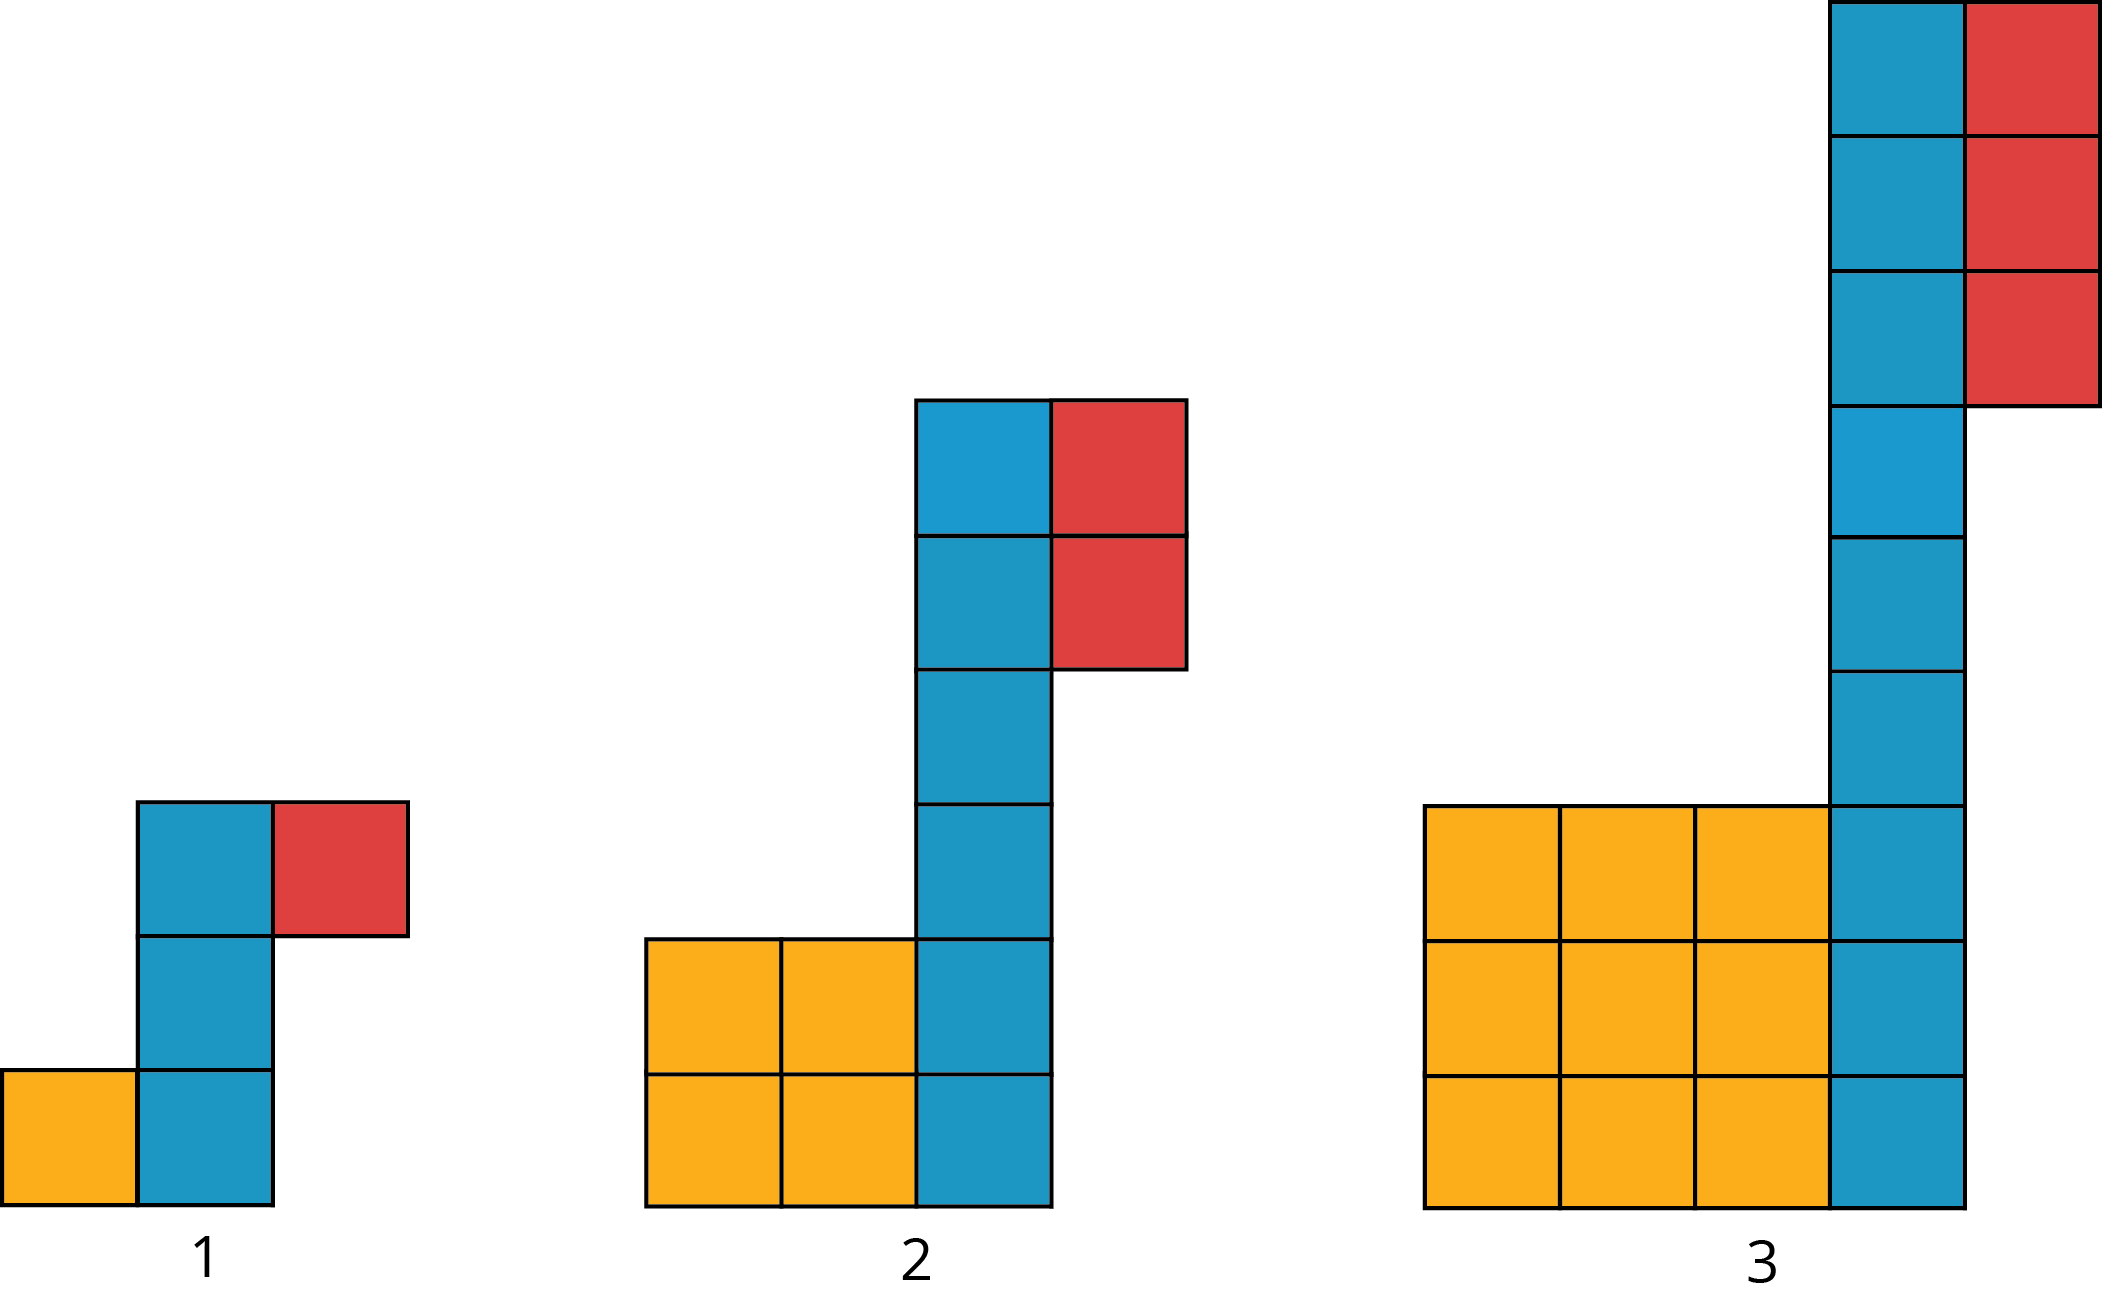
Look for a growing pattern. Describe the pattern you see.

  1. If your pattern continues growing in the same way, how many tiles of each color will be in the 4th and 5th diagram? The 10th diagram?

  2. How many tiles of each color will be in the $n$th diagram? Be prepared to explain how your reasoning.

6.2: Slopes, Vertical Intercepts, and Graphs

Your teacher will give you 6 cards describing different situations and 6 cards with graphs.

  1. Match each situation to a graph.
  2. Pick one proportional relationship and one non-proportional relationship and answer the following questions about them.
    1. How can you find the slope from the graph? Explain or show your reasoning.
    2. Explain what the slope means in the situation.
    3. Find the point where the line crosses the vertical axis. What does that point tell you about the situation?

6.3: Summer Reading

Lin has a summer reading assignment. After reading the first 30 pages of the book, she plans to read 40 pages each day until she finishes. Lin makes the graph shown here to track how many total pages she'll read over the next few days.

After day 1, Lin reaches page 70, which matches the point $(1,70)$ she made on her graph. After day 4, Lin reaches page 190, which does not match the point $(4,160)$ she made on her graph. Lin is not sure what went wrong since she knows she followed her reading plan.

  1. Sketch a line showing Lin's original plan on the axes.
  2. What does the vertical intercept mean in this situation? How do the vertical intercepts of the two lines compare?

  3. What does the slope mean in this situation? How do the slopes of the two lines compare?

Summary

At the start of summer break, Jada and Lin decide to save some of the money they earn helping out their neighbors to use during the school year. Jada starts by putting \$20 into a savings jar in her room and plans to save \$10 a week. Lin starts by putting \$10 into a savings jar in her room plans to save \$20 a week. Here are graphs of how much money they will save after 10 weeks if they each follow their plans:

The value where a line intersects the vertical axis is called the vertical intercept. When the vertical axis is labeled with a variable like $y$, this value is also often called the $y$-intercept. Jada's graph has a vertical intercept of \$20 while Lin's graph has a vertical intercept of \$10. These values reflect the amount of money they each started with. At 1 week they will have saved the same amount, \$30. But after week 1, Lin is saving more money per week (so she has a larger rate of change), so she will end up saving more money over the summer if they each follow their plans.

Practice Problems ▶

Glossary

vertical intercept

vertical intercept

The vertical intercept of a graph is the point where the graph crosses the vertical axis. If the axis is labeled with the variable $y$, the vertical intercept is also called the $y$-intercept. Also, the term is sometimes used to mean just the $y$-coordinate of the point where the graph crosses the vertical axis. The vertical intercept of the graph of $y = 3x - 5$ is $(0,\text-5)$, or just -5.