Lesson 8: Translating to $y=mx+b$

Let’s see what happens to the equations of translated lines.

8.1: Lines that Are Translations

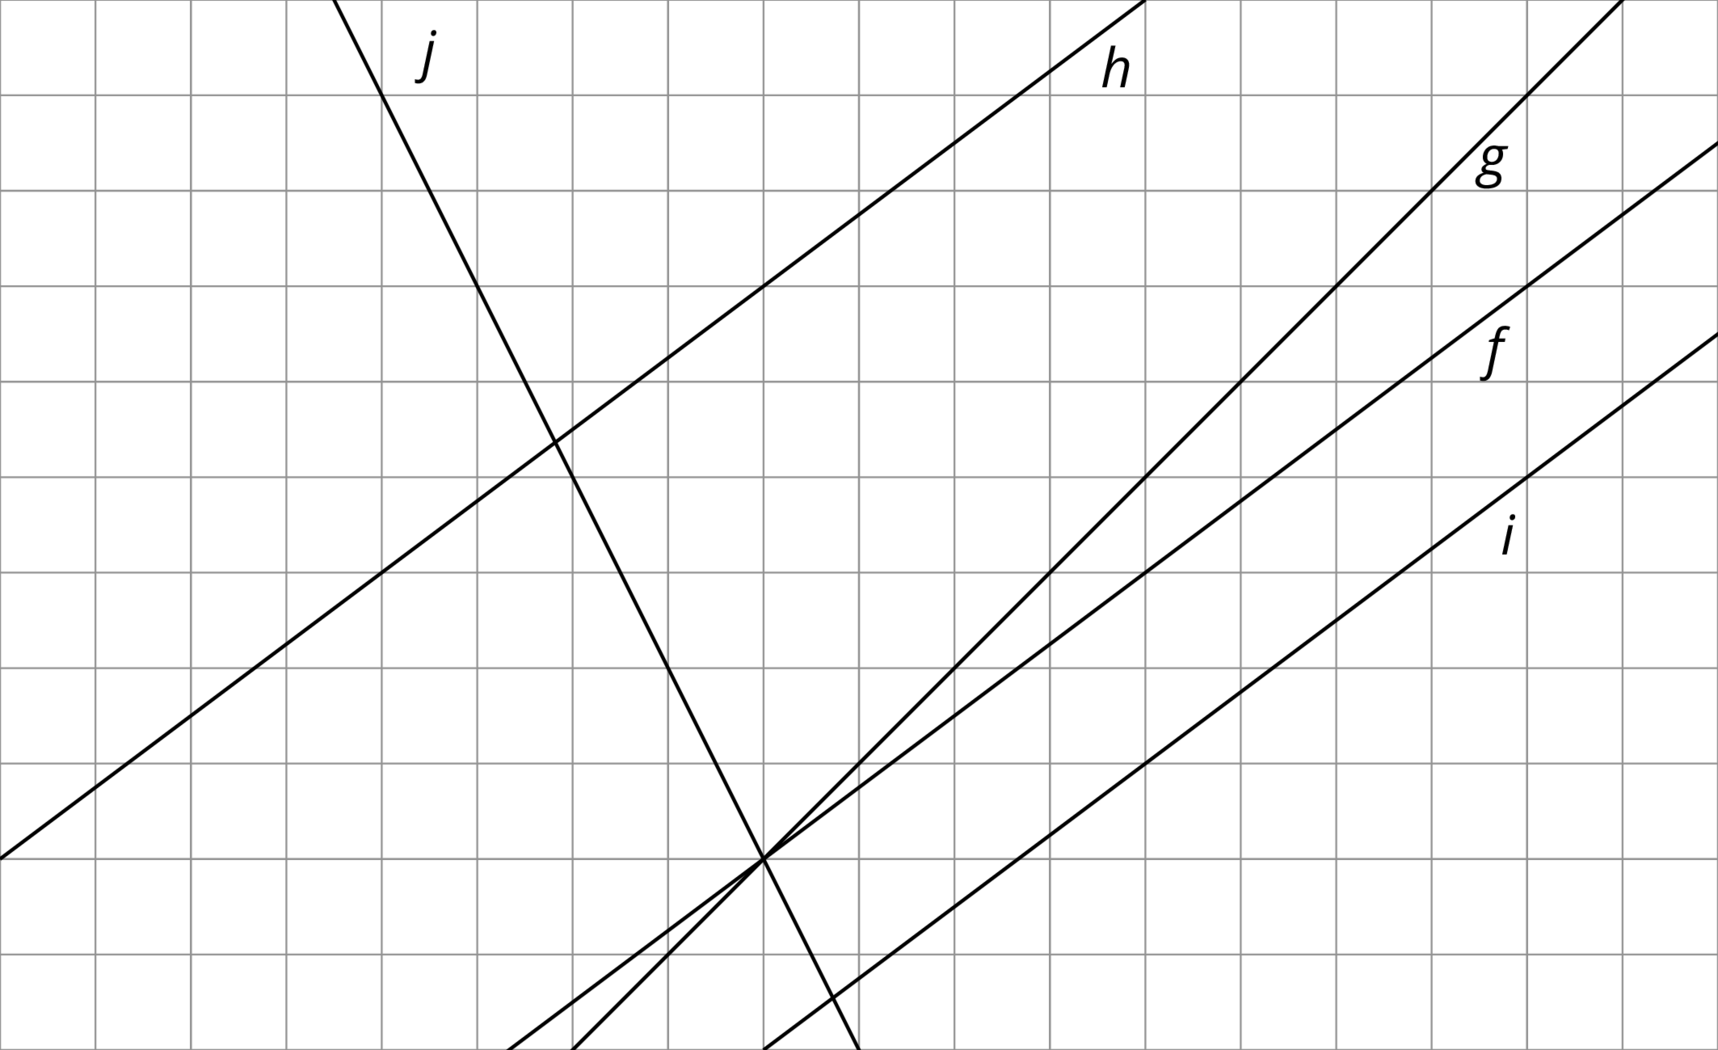
The diagram shows several lines. You can only see part of the lines, but they actually continue forever in both directions.

  1. Which lines are images of line $f$ under a translation?
  2. For each line that is a translation of $f$, draw an arrow on the grid that shows the vertical translation distance.

8.2: Increased Savings

GeoGebra Applet VZ4fhUTJ

  1. Diego earns \$10 per hour babysitting. Assume that he has no money saved before he starts babysitting and plans to save all of his earnings. Graph how much money, $y$, he has after $x$ hours of babysitting.

  2. Now imagine that Diego started with \$30 saved before he starts babysitting. On the same set of axes, graph how much money, $y$, he would have after $x$ hours of babysitting.

  3. Compare the second line with the first line. How much more money does Diego have after 1 hour of babysitting? 2 hours? 5 hours? $x$ hours?

  4. Write an equation for each line.

8.3: Translating a Line

GeoGebra Applet vA4jWCZ6

  1. Experiment with moving point $A$.
    1. Place point $A$ in three different locations above the $x$-axis. For each location, write the equation of the line and the coordinates of point $A$.
    2. Place point $A$ in three different locations below the $x$-axis. For each location, write the equation of the line and the coordinates of point $A$.
    3. In the equations, what changes as you move the line? What stays the same?
    4. If the line passes through the origin, what equation is displayed? Why do you think this is the case?
  2. Your teacher will give you 12 cards. There are 4 pairs of lines, A–D, showing the graph, $a$, of a proportional relationship and the image, $h$, of $a$ under a translation. Match each line $h$ with an equation and either a table or description. For the line with no matching equation, write one on the blank card.

Summary

During an early winter storm, the snow fell at a rate of $\frac12$ inches per hour. We can see the rate of change, $\frac12$, in both the equation that represents this storm, $y=\frac12x$, and in the slope of the line representing this storm.

In addition to being a linear relationship between the time since the beginning of the storm and the depth of the snow, we can also call this as a proportional relationship since the depth of snow was 0 at the beginning of the storm.

During a mid-winter storm, the snow again fell at a rate of $\frac12$ inches per hour, but this time there was already 5 inches of snow on the ground. We can graph this storm on the same axes as the first storm by taking all the points on the graph of the first storm and translating them up 5 inches.

2 hours after each storm begins, 1 inch of new snow has fallen. For the first storm, this means there is now 1 inch of snow on the ground. For the second storm, this means there are now 6 inches of snow on the ground. Unlike the first storm, the second is not a proportional relationship since the line representing the second storm has a vertical intercept of 5. The equation representing the storm, $y=\frac12x+5$, is of the form $y=mx+b$, where $m$ is the rate of change, also the slope of the graph, and $b$ is the initial amount, also the vertical intercept of the graph.

Practice Problems ▶