Lesson 10: Piecewise Linear Functions

Let’s explore functions built out of linear pieces.

10.1: Notice and Wonder: Lines on Dots

What do you notice? What do you wonder?


10.2: Modeling Recycling

 
  1. Approximate the percentage recycled each year with a piecewise linear function by drawing between three and five line segments to approximate the graph.
  2. Find the slope for each piece. What do these slopes tell you?

10.3: Dog Bath

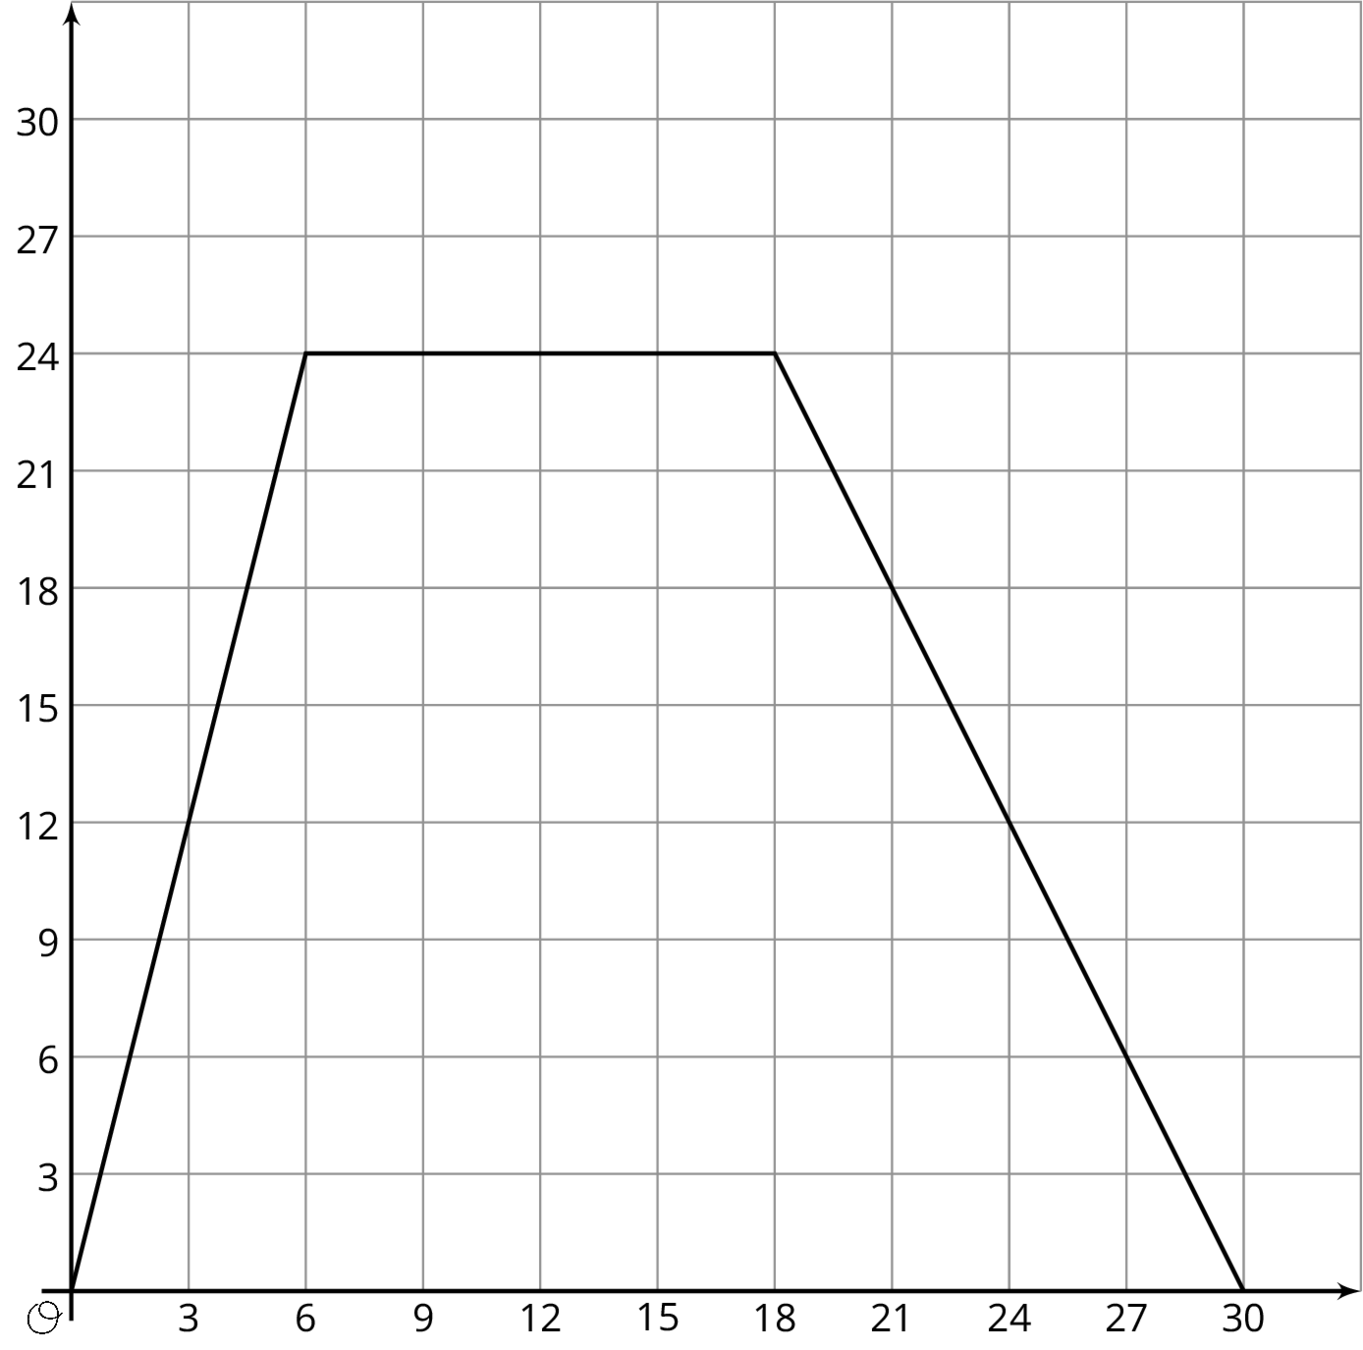
Elena filled up the tub and gave her dog a bath. Then she let the water out of the tub.

A graph of three connected line segments on the coordinate plane. The numbers 0 through 30, in increments of 3 are indicated on both the horizontal and vertical axes. The first line segment begins at the origin and moves steadily upward and to the right, passing through the point 3 comma 12 and ends at the point 6 comma 24. The second line begins where the first line segment ends, moves horizontally and to the right, ending at the point 18 comma 24. The third line segment begins where the second line segment ends, moves steadily downward and to the right, passing through the point 21 comma 18 and ends at the point 30 comma 0.
 
  1. The graph shows the amount of water in the tub, in gallons, as a function of time, in minutes. Add labels to the graph to show this.
  2. When did she turn off the water faucet?
  3. How much water was in the tub when she bathed her dog?
  4. How long did it take for the tub to drain completely?
  5. At what rate did the faucet fill the tub?
  6. At what rate did the water drain from the tub?

10.4: Distance and Speed

The graph of three connected line segments on the coordinate plane. The horizontal axis is labeled "time" and the vertical axis is labeled "speed." The first line segment begins at the origin and moves steadily upward and to the right. The second line segment begins where the first line segment ends, moves horizontally and to the right. The third line segment begins where the second line segment ends, moves steadily downward and to the right, ending on the horizontal axis.

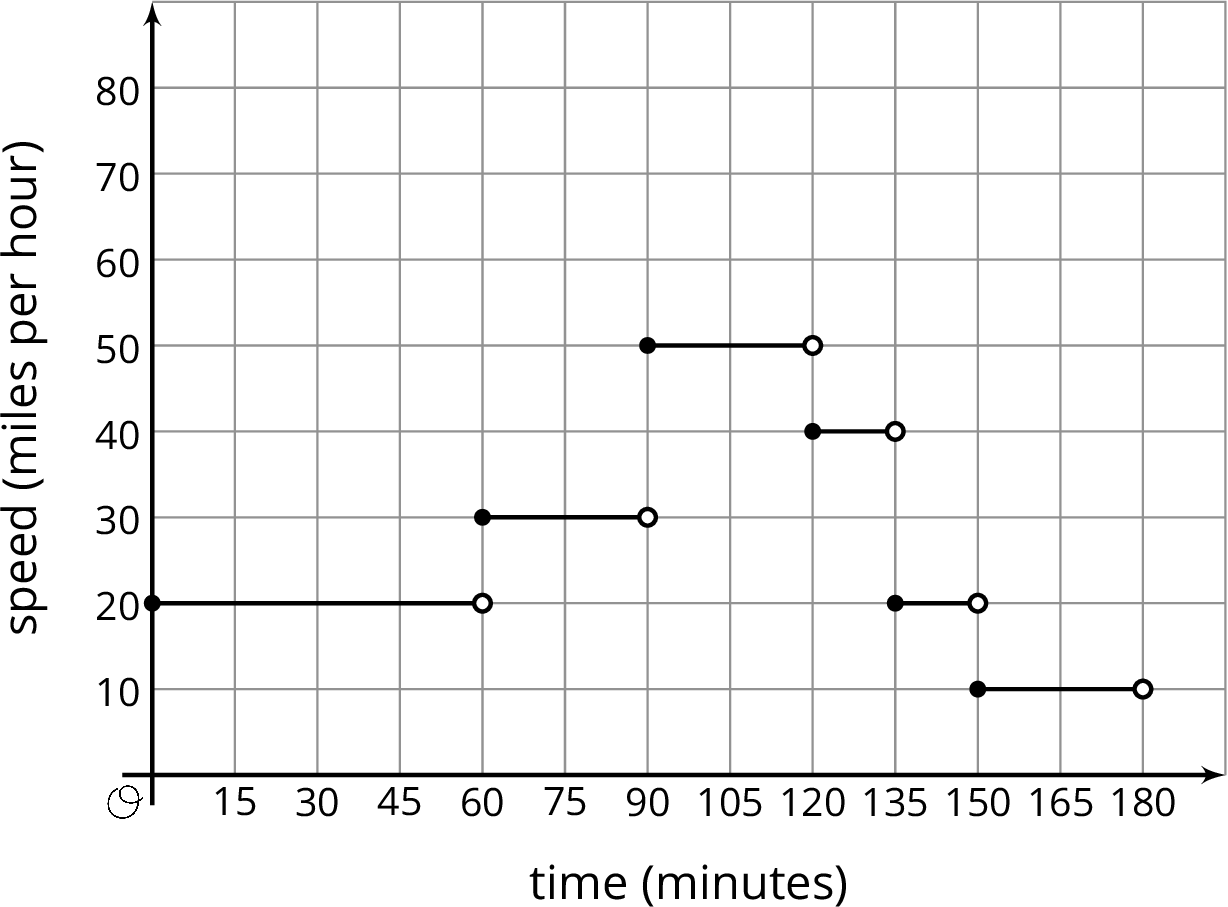
The graph shows the speed of a car as a function of time. Describe what a person watching the car would see.

Summary

This graph shows Andre biking to his friend’s house where he hangs out for a while. Then they bike together to the store to buy some groceries before racing back to Andre’s house for a movie night. Each line segment in the graph represents a different part of Andre’s travels.

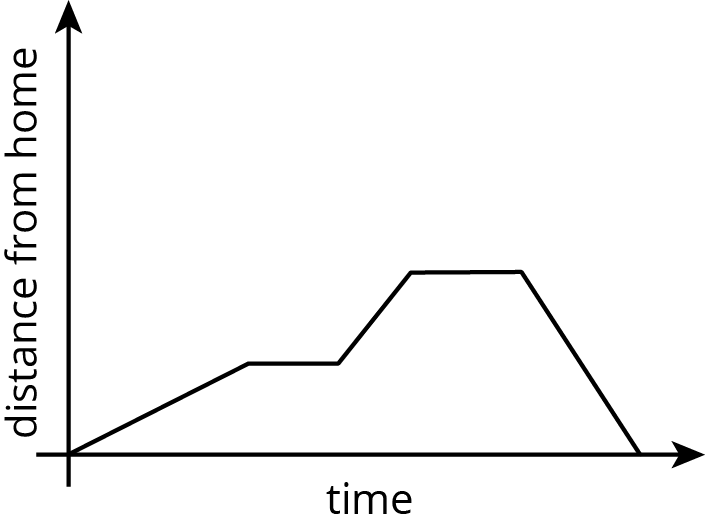
This is an example of a piecewise linear function, which is a function whose graph is pieced together out of line segments. It can be used to model situations in which a quantity changes at a constant rate for a while, then switches to a different constant rate.

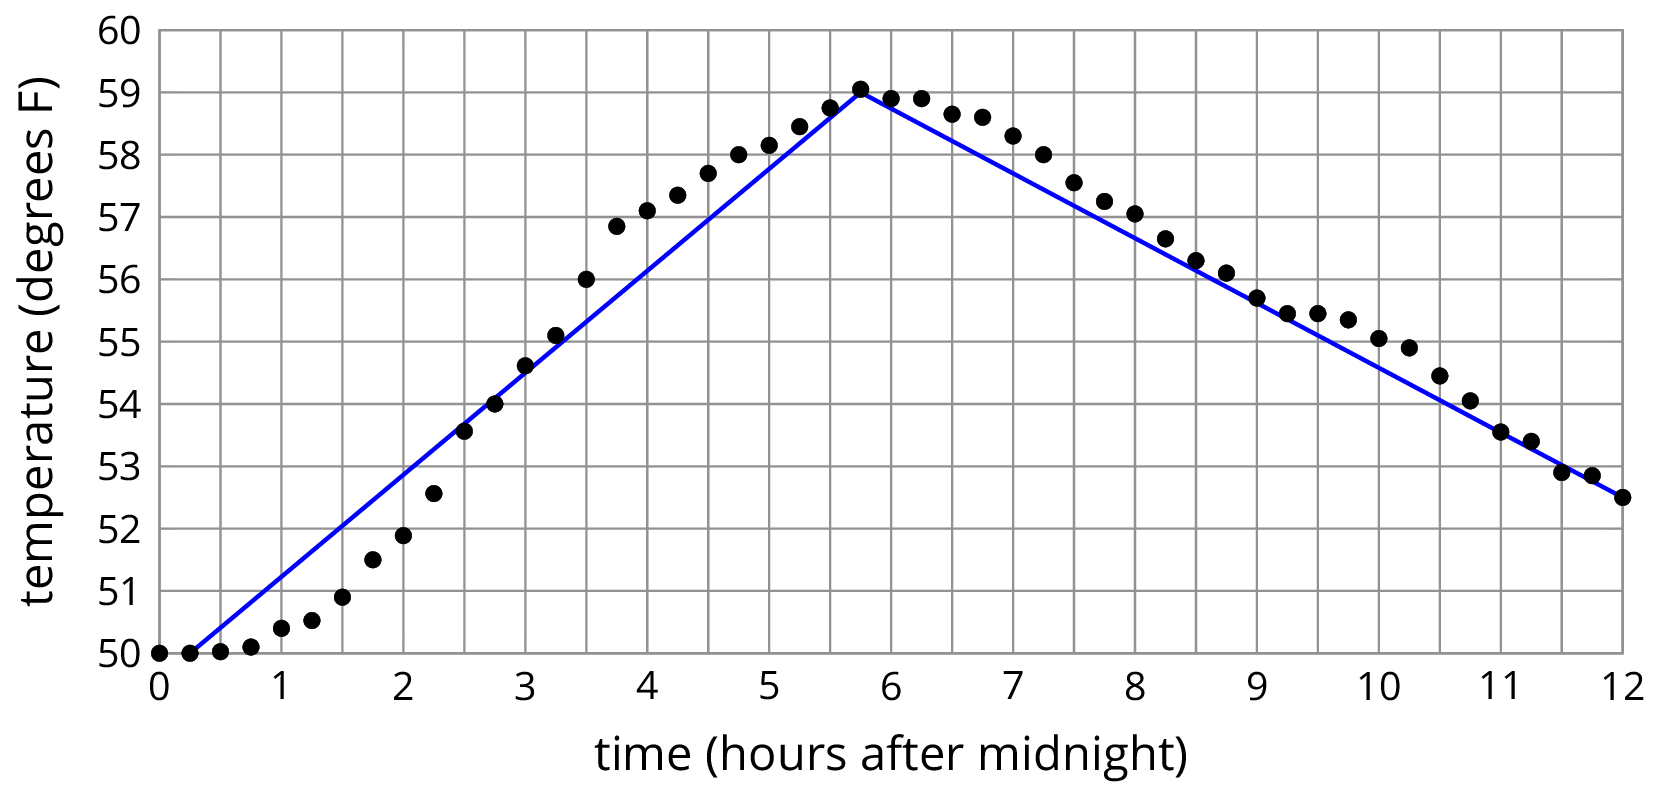
We can use piecewise functions to represent stories, or we can use them to model actual data. In the second example, temperature recordings at several times throughout a day are modeled with a piecewise function made up of two line segments. Which line segment do you think does the best job of modeling the data?

Practice Problems ▶