7.1: Which are the Same? Which are Different?
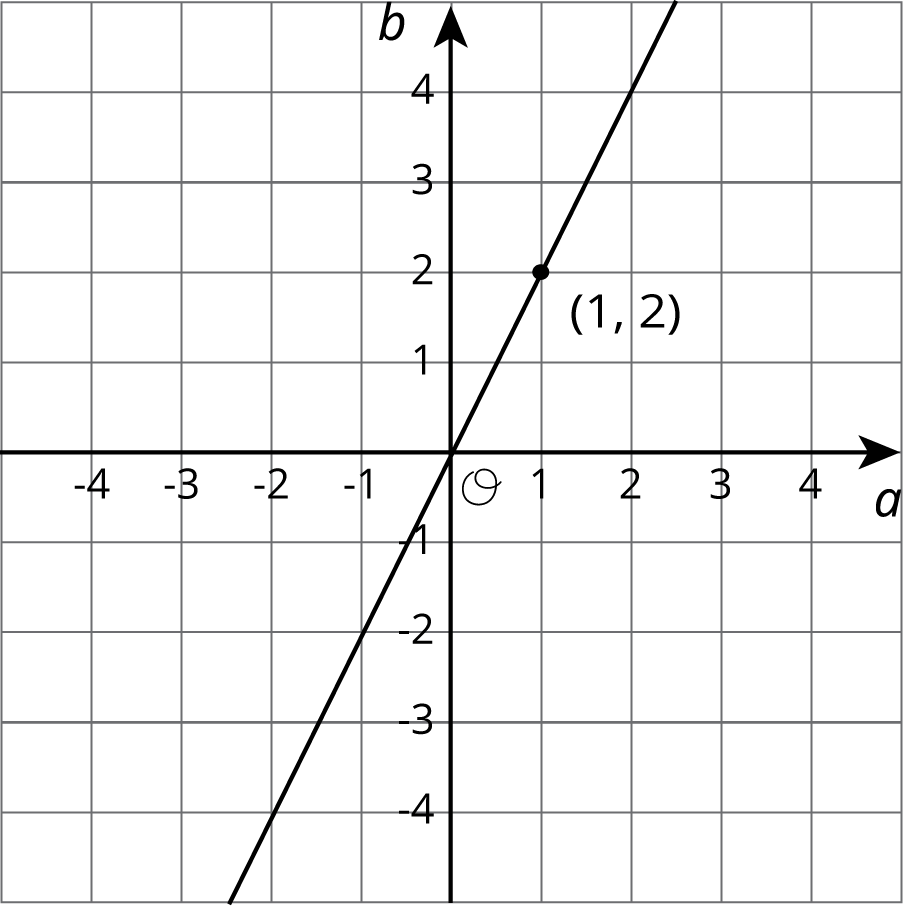
Here are three different ways of representing functions. How are they alike? How are they different?
- $y = 2x$
-
$p$ -2 -1 0 1 2 3 $q$ 4 2 0 -2 -4 -6
Let’s connect tables, equations, graphs, and stories of functions.
Here are three different ways of representing functions. How are they alike? How are they different?
| $p$ | -2 | -1 | 0 | 1 | 2 | 3 |
|---|---|---|---|---|---|---|
| $q$ | 4 | 2 | 0 | -2 | -4 | -6 |
The graph shows the temperature between noon and midnight in City A on a certain day.
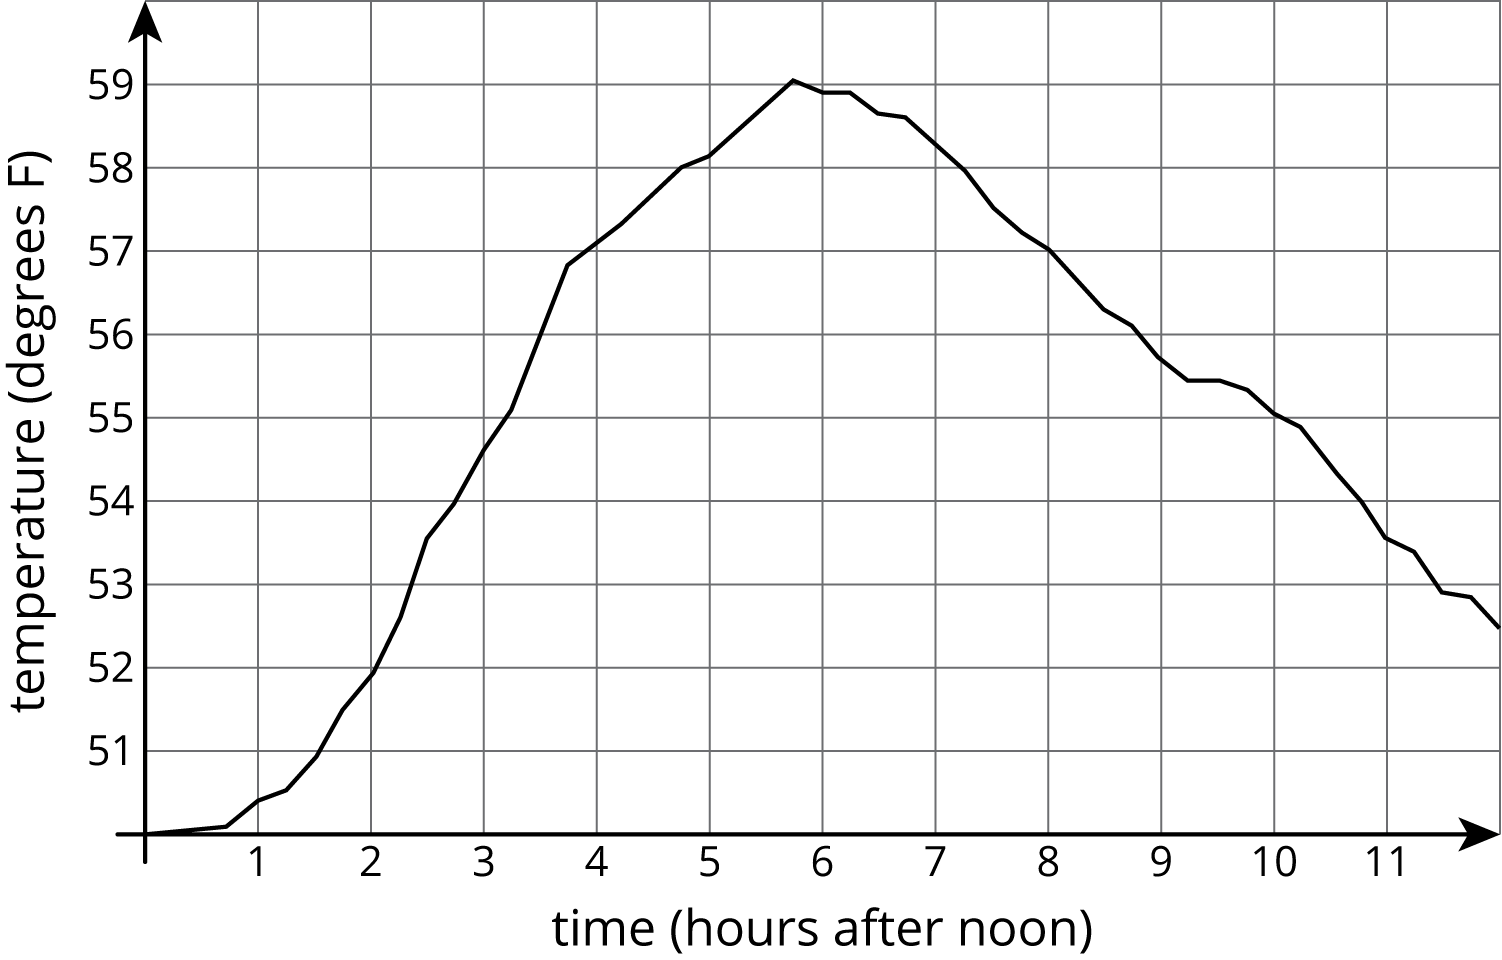
The table shows the temperature, $T$, in degrees Fahrenheit, for $h$ hours after noon, in City B.
| $h$ | 1 | 2 | 3 | 4 | 5 | 6 |
|---|---|---|---|---|---|---|
| $T$ | 82 | 78 | 75 | 62 | 58 | 59 |
The volume, $V$, of a cube with side length $s$ is given by the equation $V = s^3$. The graph of the volume of a sphere as a function of its radius is shown.
Is the volume of a cube with side length $s=3$ greater or less than a sphere with radius 3?
Estimate the radius of a sphere that has the same volume as a cube with side length 5.
Compare the outputs of the two volume functions when the inputs are 2.
Here is an applet to use if you choose. Note: If you want to graph an equation with this applet, it expects you to enter $y$ as a function of $x$, so you need to use $y$ instead of $V$ and $x$ instead of $s$.
Elena’s family is driving on the freeway at 55 miles per hour.
Andre’s family is driving on the same freeway, but not at a constant speed. The table shows how far Andre's family has traveled, $d$, in miles, every minute for 10 minutes.
| $t$ | 1 | 2 | 3 | 4 | 5 | 6 | 7 | 8 | 9 | 10 |
|---|---|---|---|---|---|---|---|---|---|---|
| $d$ | 0.9 | 1.9 | 3.0 | 4.1 | 5.1 | 6.2 | 6.8 | 7.4 | 8 | 9.1 |
Functions are all about getting outputs from inputs. For each way of representing a function—equation, graph, table, or verbal description—we can determine the output for a given input.
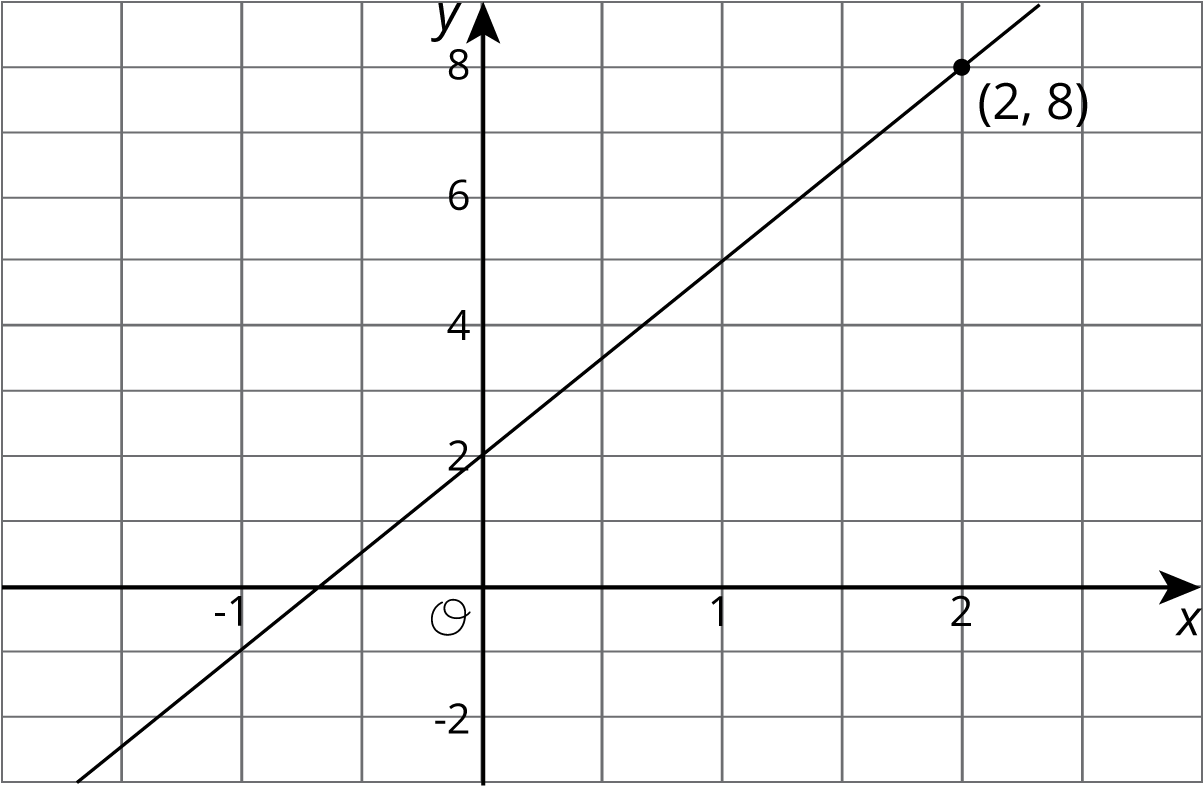
Let's say we have a function represented by the equation $y = 3x +2$ where $y$ is the dependent variable and $x$ is the independent variable. If we wanted to find the output that goes with 2, we can input 2 into the equation for $x$ and finding the corresponding value of $y$. In this case, when $x$ is 2, $y$ is 8 since $3\boldcdot 2 + 2=8$.
If we had a graph of this function instead, then the coordinates of points on the graph are the input-output pairs. So we would read the $y$-coordinate of the point on the graph that corresponds to a value of 2 for $x$. Looking at the graph of this function here, we can see the point $(2,8)$ on it, so the output is 8 when the input is 2.
A table representing this function shows the input-output pairs directly (although only for select inputs).
| $x$ | -1 | 0 | 1 | 2 | 3 |
|---|---|---|---|---|---|
| $y$ | -1 | 2 | 5 | 8 | 11 |
Again, the table shows that if the input is 2, the output is 8.