3.1: The Giant Panda
A giant panda lives in a zoo. What does the point on the graph tell you about the panda?
 Giant Panda 2
Copyright Owner:
Sheila Lau (Own Work)
License:
Public Domain
Via:
Wikimedia Commons
Giant Panda 2
Copyright Owner:
Sheila Lau (Own Work)
License:
Public Domain
Via:
Wikimedia Commons

Let’s investigate points in scatter plots.
A giant panda lives in a zoo. What does the point on the graph tell you about the panda?
Giant Panda 2
Copyright Owner:
Sheila Lau (Own Work)
License:
Public Domain
Via:
Wikimedia Commons
The table shows the weight and fuel efficiency of 18 different cars.
| car | weight (kg) | fuel efficiency (mpg) |
|---|---|---|
| A | $1,\!549$ | 25 |
| B | $1,\!610$ | 20 |
| C | $1,\!737$ | 21 |
| D | $1,\!777$ | 20 |
| E | $1,\!486$ | 23 |
| F | $1,\!962$ | 16 |
| G | $2,\!384$ | 16 |
| H | $1,\!957$ | 19 |
| I | $2,\!212$ | 16 |
| J | $1,\!115$ | 29 |
| K | $2,\!068$ | 18 |
| L | $1,\!663$ | 19 |
| M | $2,\!216$ | 18 |
| N | $1,\!432$ | 25 |
| O | $1,\!987$ | 18 |
| P | $1,\!580$ | 26 |
| Q | $1,\!234$ | 30 |
| R | $1,\!656$ | 23 |
The data points in the table are shown in this scatter plot.
You can hide the expressions list using the double arrow. You can click on a point to see its coordinates.
Which point in the scatter plot represents Car L’s measurements? Drag the circle around the correct point.
What is the fuel efficiency of the car with the greatest weight?
What is the weight of the car with the greatest fuel efficiency?
Car S weighs 1,912 kilograms and gets 16 miles per gallon. On the scatter plot, plot a point that represents Car S’s measurements.
Cars N and O, shown in the scatter plot, are made by the same company. Compare their weights and fuel efficiencies. Does anything surprise you about these cars?
A different company makes Cars F and G. Compare their weights and fuel efficiencies. Does anything surprise you about these cars?
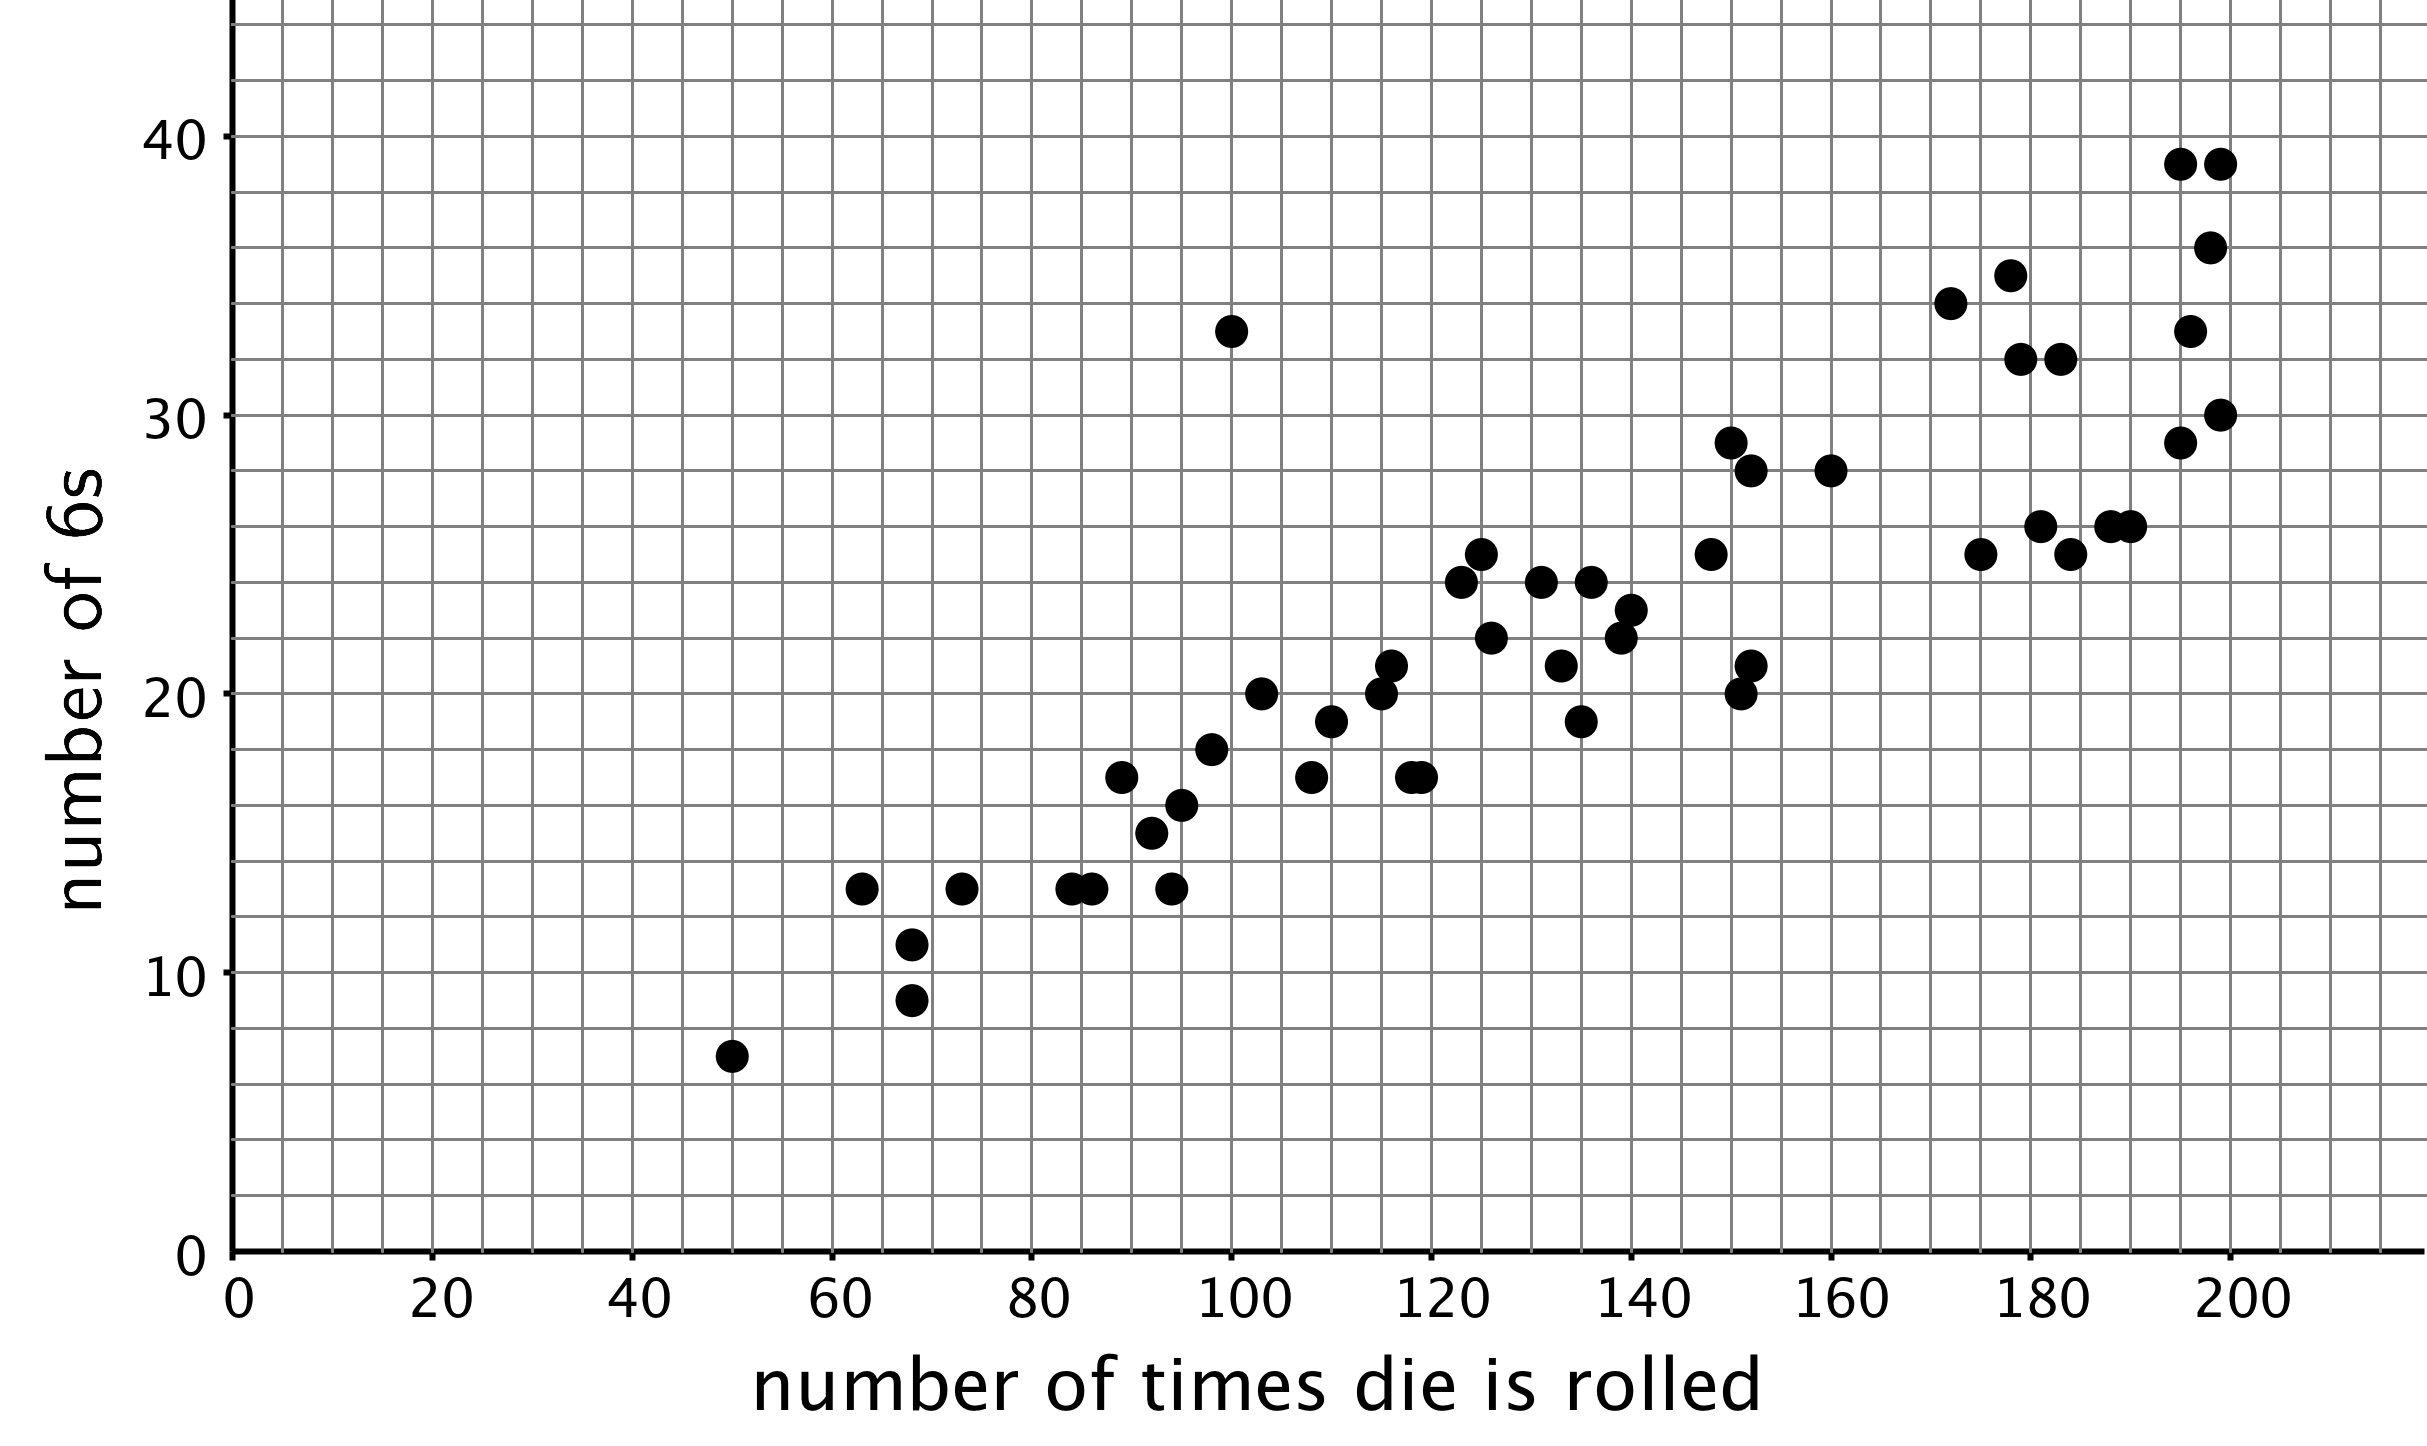
After a board game competition, the tournament director collects 50 dice from the games played and rolls each one until he gets bored and tries a different one. The scatter plot shows the number of times he rolled each die and the number of 6s that resulted during those rolls.
A clothing store keeps track of the average monthly temperature in degrees Celsius and coat sales in dollars.
| temperature (degrees Celsius) | coat sales (dollars) | |
|---|---|---|
| Row 1 | -5 | 1,550 |
| Row 2 | -3 | 1,340 |
| Row 3 | 3 | 1,060 |
| Row 4 | 8 | 1,070 |
| Row 5 | 15 | 680 |
| Row 6 | 21 | 490 |
| Row 7 | 23 | 410 |
| Row 8 | 21 | 510 |
| Row 9 | 17 | 600 |
| Row 10 | 11 | 740 |
| Row 11 | 6 | 940 |
| Row 12 | -2 | 1,390 |

Scatter plots show two measurements for each individual from a group. For example, this scatter plot shows the weight and height for each dog from a group of 25 dogs.
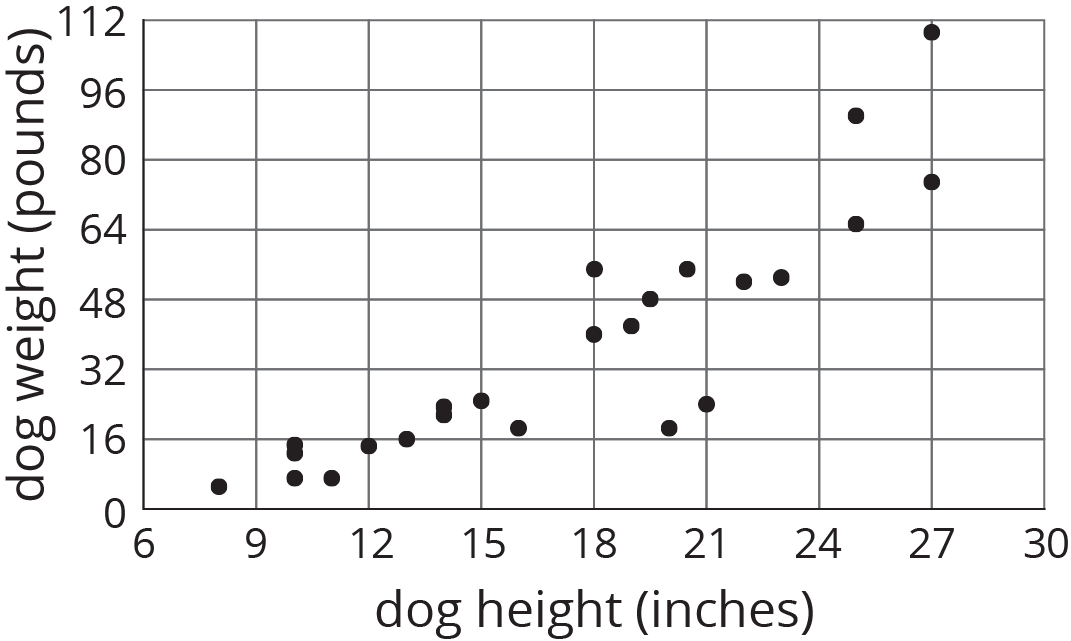
We can see that the tallest dogs are 27 inches, and that one of those tallest dogs weighs about 75 pounds while the other weighs about 110 pounds. This shows us that dog weight is not a function of dog height because there would be two different outputs for the same input. But we can see a general trend: Taller dogs tend to weigh more than shorter dogs. There are exceptions. For example, there is a dog that is 18 inches tall and weighs over 50 pounds, and there is another dog that is 21 inches tall but weighs less than 30 pounds.
When we collect data by measuring attributes like height, weight, area, or volume, we call the data numerical data (or measurement data), and we say that height, weight, area, or volume is a numerical variable. Upcoming lessons will discuss how to identify and describe trends in data that has been collected.