Lesson 11: Interpreting Graphs of Proportional Relationships

Let’s read stories from the graphs of proportional relationships.

11.1: What Could the Graph Represent?

Here is a graph that represents a proportional relationship.

A line is graphed in the coordinate plane with the origin labeled “O”. The x axis has the numbers 0 through 20, in increments of 2, indicated. The y axis has the numbers 0 through 20, in increments of 2, indicated. The line begins at the origin. It moves gradually upward and to the right passing through the point with coordinates 8 comma 6. There is also a point indicated on the line and the coordinates of that point have integer values.
  1. Invent a situation that could be represented by this graph.
  2. Label the axes with the quantities in your situation.
  3. Give the graph a title.
  4. There is a point on the graph. What are its coordinates? What does it represent in your situation?

11.2: Tyler's Walk

Tyler was at the amusement park. He walked at a steady pace from the ticket booth to the bumper cars.

  1. The point on the graph shows his arrival at the bumper cars. What do the coordinates of the point tell us about the situation?
  2. The table representing Tyler's walk shows other values of time and distance. Complete the table. Next, plot the pairs of values on the grid.

A coordinate plane with the origin labeled “O”. The horizontal axis is labeled “elapsed time in seconds” and the numbers 0 through 60, in increments of 10, are indicated. There are vertical gridlines midway between. The vertical axis is labeled “distance from the ticket booth in meters” and the numbers 0 through 60, in increments of 10, are indicated. There are horizontal gridlines midway between. The point with coordinates 40 comma 50 is indicated.

row 1 time
(seconds)
distance
(meters)
row 2 0 0
row 3 20 25
row 4 30 37.5
row 5 40 50
row 6 1  
  1. What does the point $(0, 0)$ mean in this situation?
  2. How far away from the ticket booth was Tyler after 1 second? Label the point on the graph that shows this information with its coordinates.
  1. What is the constant of proportionality for the relationship between time and distance? What does it tell you about Tyler's walk? Where do you see it in the graph?

11.3: Seagulls Eat What?

4 seagulls ate 10 pounds of garbage. Assume this information describes a proportional relationship.

  1. Plot a point that shows the number of seagulls and the amount of garbage they ate.
  2. Use a straight edge to draw a line through this point and $(0,0)$.
  3. Plot the point $(1, k)$ on the line. What is the value of $k$? What does the value of $k$ tell you about this context?

GeoGebra Applet f6YyUjVc

Summary

For the relationship represented in this table, $y$ is proportional to $x$. We can see in the table that $\frac54$ is the constant of proportionality because it’s the $y$ value when $x$ is 1.

The equation $y = \frac54 x$ also represents this relationship.

    $x$     $y$  
row 1 4 5
row 2 5 $\frac{25}{4}$
row 3 8 10
row 4 1 $\frac{5}{4}$

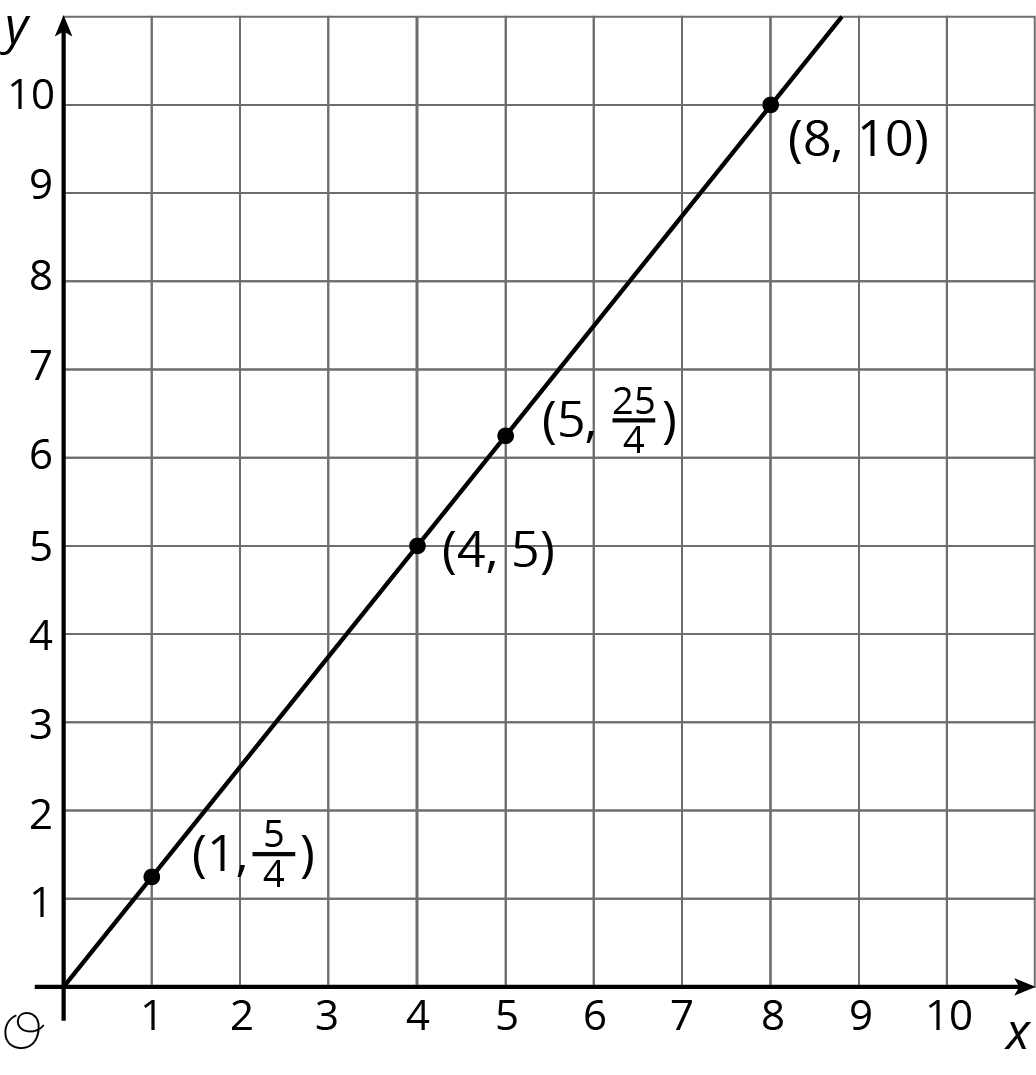
Here is the graph of this relationship.

A line is graphed in the coordinate plane with the origin labeled “O”. The numbers 0 through 10 are indicated on the x axis. The numbers 0 through 10 are indicated on they axis. The line begins at the origin. It moves steadily upward and to the right passing through the points with coordinates 1 comma five-fourths, 4 comma 5, 5 comma 25 fourths, and 8 comma 10.

If $y$ represents the distance in feet that a snail crawls in $x$ minutes, then the point $(4, 5)$ tells us that the snail can crawl 5 feet in 4 minutes.

If $y$ represents the cups of yogurt and $x$ represents the teaspoons of cinnamon in a recipe for fruit dip, then the point $(4, 5)$ tells us that you can mix 4 teaspoons of cinnamon with 5 cups of yogurt to make this fruit dip.

We can find the constant of proportionality by looking at the graph, because $\frac54$ is the $y$-coordinate of the point on the graph where the $x$-coordinate is 1. This could mean the snail is traveling $\frac54$ feet per minute or that the recipe calls for $1\frac14$ cups of yogurt for every teaspoon of cinnamon.

In general, when $y$ is proportional to $x$, the corresponding constant of proportionality is the $y$-value when $x=1$. 

Practice Problems ▶