11.1: Notice and Wonder: Comparing Heights
What do you notice? What do you wonder?
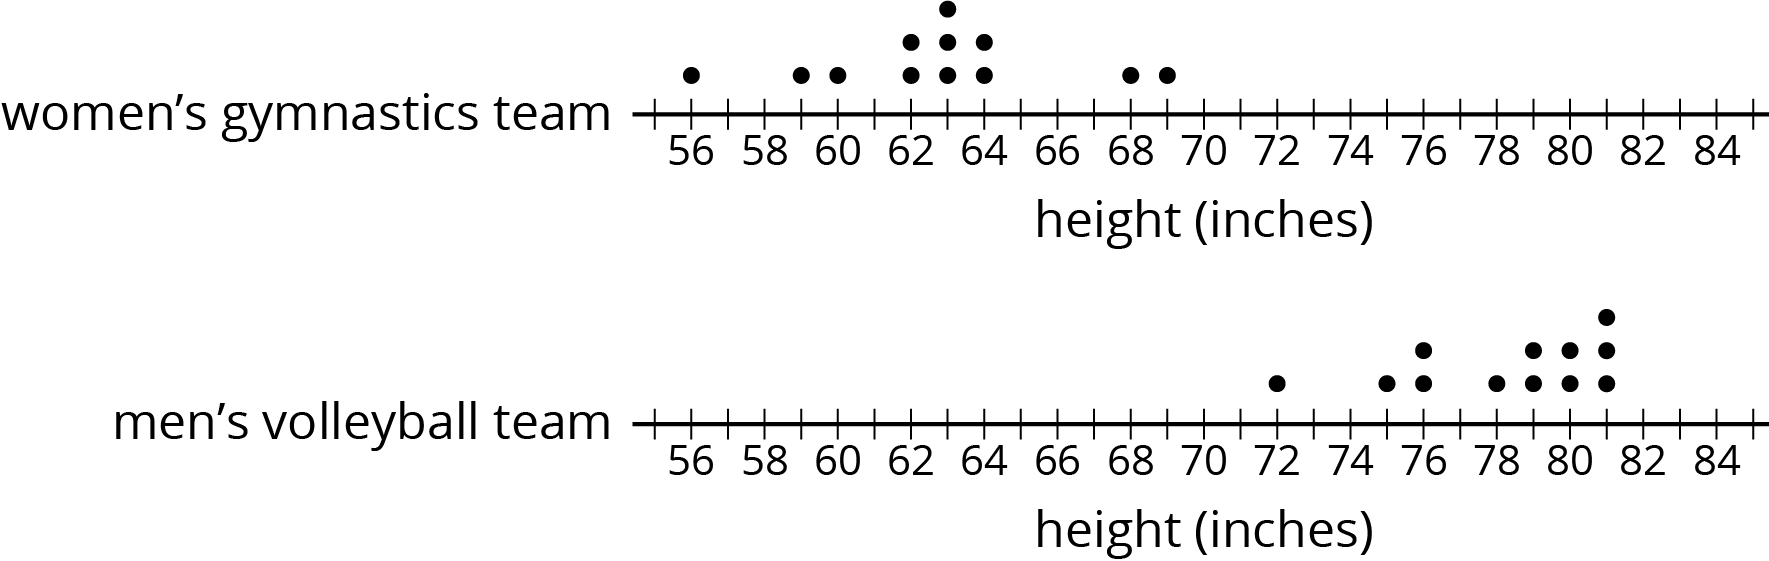
Let’s compare two groups.
What do you notice? What do you wonder?
How much taller is the volleyball team than the gymnastics team?
Gymnastics team’s heights (in inches) : 56, 59, 60, 62, 62, 63, 63, 63, 64, 64, 68, 69
Volleyball team’s heights (in inches): 72, 75, 76, 76, 78, 79, 79, 80, 80, 81, 81, 81
Make dot plots to compare the heights of the tennis and badminton teams.
Tennis team’s heights (in inches): 66, 67, 69, 70, 71, 73, 73, 74, 75, 75, 76
Badminton team’s heights (in inches): 62, 62, 65, 66, 68, 71, 73
What do you notice about your dot plots?
Compare the heights of these two families. Explain or show your reasoning.
The heights (in inches) of Noah’s family members: 28, 39, 41, 52, 63, 66, 71
The heights (in inches) of Jada’s family members: 49, 60, 68, 70, 71, 73, 77
If Jada's family adopts newborn twins who are each 18 inches tall, does this change your thinking? Explain your reasoning.
Here are three dot plots that represent the lengths, in minutes, of songs on different albums.
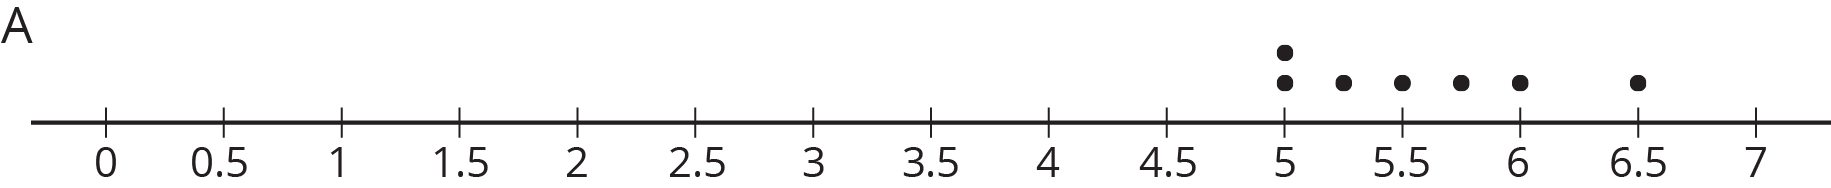
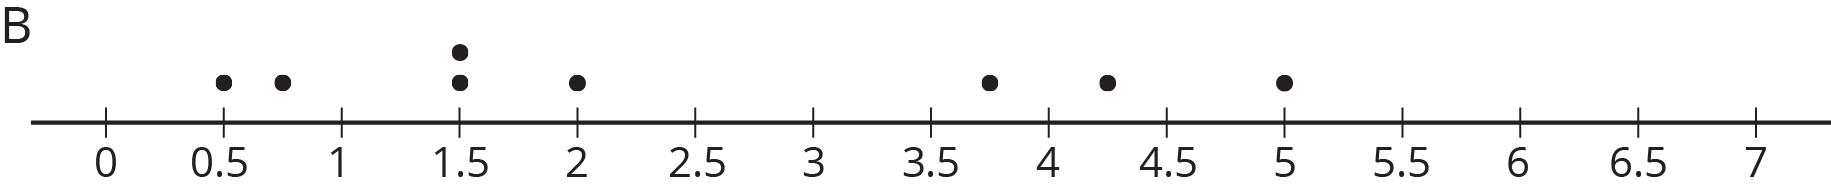
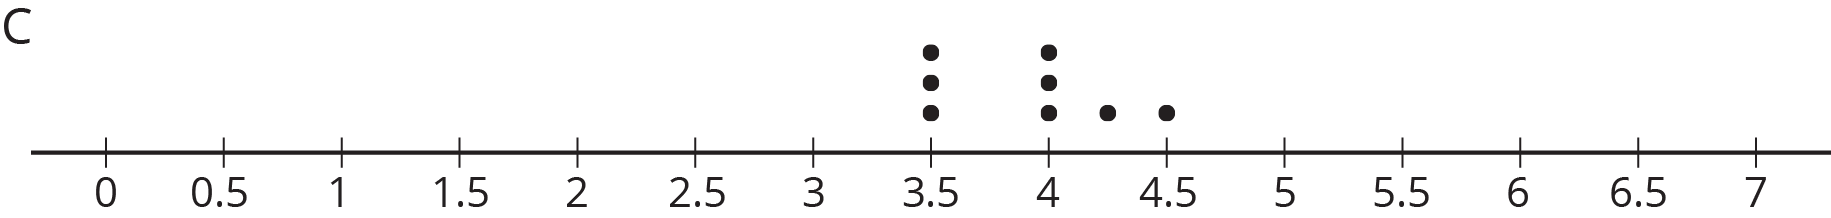
One of these data sets has a mean of 5.57 minutes and another has a mean of 3.91 minutes.
One of these data sets has a mean absolute deviation of 0.30 and another has a MAD of 0.44.
Do you think the three groups are very different or not? Be prepared to explain your reasoning.
A fourth album has a mean length of 8 minutes with a mean absolute deviation of 1.2. Is this data set very different from each of the others?
Comparing two individuals is fairly straightforward. The question "Which dog is taller?" can be answered by measuring the heights of two dogs and comparing them directly. Comparing two groups can be more challenging. What does it mean for the basketball team to generally be taller than the soccer team?
To compare two groups, we use the distribution of values for the two groups. Most importantly, a measure of center (usually mean or median) and its associated measure of variability (usually mean absolute deviation or interquartile range) can help determine the differences between groups.
For example, if the average height of pugs in a dog show is 11 inches, and the average height of the beagles in the dog show is 15 inches, it seems that the beagles are generally taller. On the other hand, if the MAD is 3 inches, it would not be unreasonable to find a beagle that is 11 inches tall or a pug that is 14 inches tall. Therefore the heights of the two dog breeds may not be very different from one another.
The mean absolute deviation measures the spread in a distribution. It is the mean of the distances of the data points from the mean of the distribution. (It is called mean absolute deviation because the distance of a data point from the mean is the absolute value of its deviation from the mean.)
The mean, or average, of a data set is the value you get by adding up all of the values in the set and dividing by the number of values in the set.
The median of a data set is the middle value when the data values are listed in order. If the number of values is even, it is the mean of the two middle values.
The interquartile range of a data set is a measure of spread of its distribution. It is the difference between the third quartile (Q3) and the first quartile (Q1).