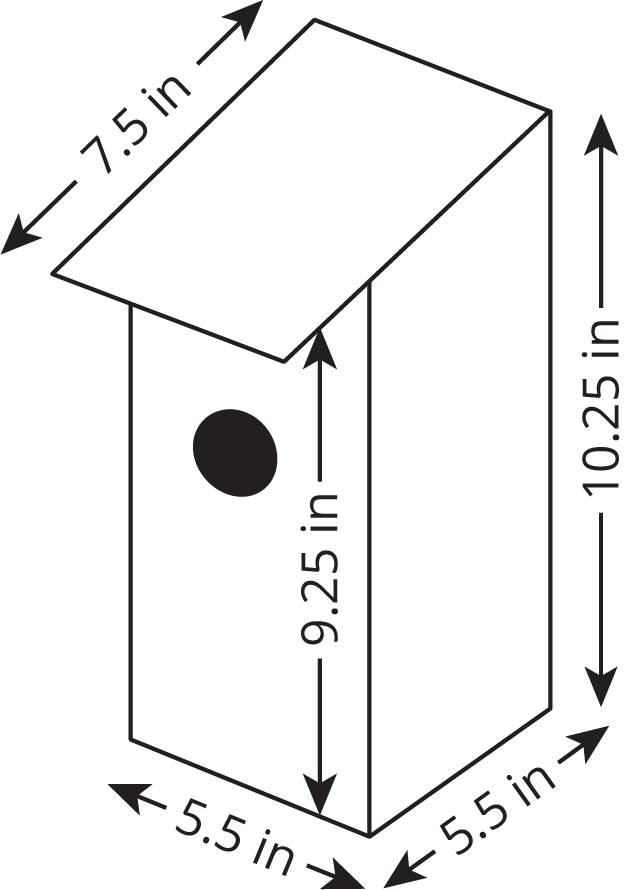
Here is a diagram of a birdhouse Elena is planning to build. (It is a simplified diagram, since in reality, the sides will have a thickness.) About how many square inches of wood does she need to build this birdhouse?
Unit 8: Practice Problem Sets
Lesson 1
Problem 1
Lin is interested in how many of her classmates watch her favorite TV show, so she starts asking around at lunch. She gets the following responses:
| yes | yes | yes | no | no | no | no |
| no | no | no | yes | no | no | no |
If she asks one more person randomly in the cafeteria, do you think they will say “yes” or “no”? Explain your reasoning.
Problem 2
An engineer tests the strength of a new material by seeing how much weight it can hold before breaking. Previous tests have held these weights in pounds:
| 1,200 | 1,400 | 1,300 | 1,500 | 950 | 1,600 | 1,100 |
Do you think that this material will be able to hold more than 1,000 pounds in the next test? Explain your reasoning.
Problem 3
A company tests two new products to make sure they last for more than a year.
- Product 1 had 950 out of 1,000 test items last for more than a year.
- Product 2 had 150 out of 200 last for more than a year.
If you had to choose one of these two products to use for more than a year, which one is more likely to last? Explain your reasoning.
Problem 4
Put these numbers in order from least to greatest.
- $\frac{1}{2}$
- $\frac{1}{3}$
- $\frac{2}{5}$
- 0.6
- 0.3
Problem 5 (from Unit 7, Lesson 15)
A small staircase is made so that the horizontal piece of each step is 10 inches long and 25 inches wide. Each step is 5 inches above the previous one. What is the surface area of this staircase?

Lesson 2
Problem 1
The likelihood that Han makes a free throw in basketball is 60%. The likelihood that he makes a 3-point shot is 0.345. Which event is more likely, Han making a free throw or making a 3-point shot? Explain your reasoning.
Problem 2
Different events have the following likelihoods. Sort them from least to greatest:
- 60%
- 8 out of 10
- 0.37
- 20%
- $\frac{5}{6}$
Problem 3
There are 25 prime numbers between 1 and 100. There are 46 prime numbers between 1 and 200. Which situation is more likely? Explain your reasoning.
- A computer produces a random number between 1 and 100 that is prime.
-
A computer produces a random number between 1 and 200 that is prime.
Problem 4 (from Unit 4, Lesson 2)
It takes $4\frac38$ cups of cheese, $\frac78$ cups of olives, and $2\frac58$ cups of sausage to make a signature pizza. How much of each ingredient is needed to make 10 pizzas? Explain or show your reasoning.
Problem 5 (from Unit 7, Lesson 16)
Problem 6 (from Unit 7, Lesson 15)
Select all the situations where knowing the surface area of an object would be more useful than knowing its volume.
- Placing an order for tiles to replace the roof of a house.
- Estimating how long it will take to clean the windows of a greenhouse.
- Deciding whether leftover soup will fit in a container.
- Estimating how long it will take to fill a swimming pool with a garden hose.
- Calculating how much paper is needed to manufacture candy bar wrappers.
- Buying fabric to sew a couch cover.
- Deciding whether one muffin pan is enough to bake a muffin recipe.
Lesson 3
Problem 1
List the sample space for each chance experiment.
-
Flipping a coin
-
Selecting a random season of the year
-
Selecting a random day of the week
Problem 2
A computer randomly selects a letter from the alphabet.
- How many different outcomes are in the sample space?
- What is the probability the computer produces the first letter of your first name?
Problem 3
What is the probability of selecting a random month of the year and getting a month that starts with the letter “J?” If you get stuck, consider listing the sample space.
Problem 4 (from Unit 2, Lesson 4)
$E$ represents an object’s weight on Earth and $M$ represents that same object’s weight on the Moon. The equation $M = \frac16E$ represents the relationship between these quantities.
- What does the $\frac16$ represent in this situation?
-
Give an example of what a person might weigh on Earth and on the Moon.
Problem 5 (from Unit 7, Lesson 13)
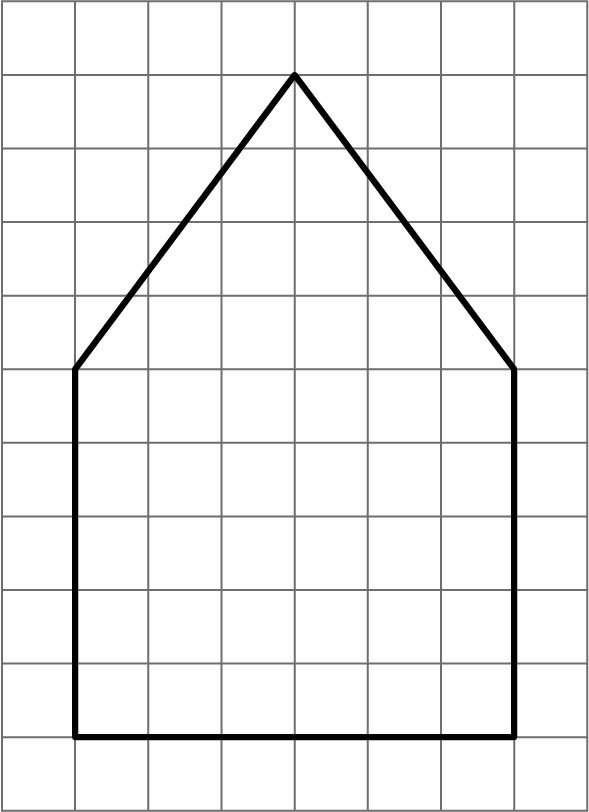
Here is a diagram of the base of a bird feeder which is in the shape of a pentagonal prism. Each small square on the grid is 1 square inch.
The distance between the two bases is 8 inches. What will be the volume of the completed bird feeder?
Problem 6 (from Unit 7, Lesson 14)
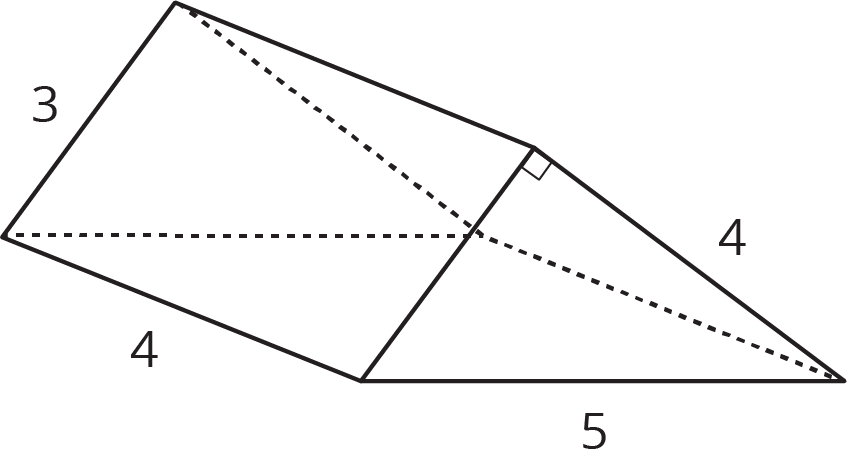
Find the surface area of the triangular prism.
Lesson 4
Problem 1
A carnival game has 160 rubber ducks floating in a pool. The person playing the game takes out one duck and looks at it.
-
If there’s a red mark on the bottom of the duck, the person wins a small prize.
-
If there’s a blue mark on the bottom of the duck, the person wins a large prize.
-
Many ducks do not have a mark.
After 50 people have played the game, only 3 of them have won a small prize, and none of them have won a large prize.
Estimate the number of the 160 ducks that you think have red marks on the bottom. Then estimate the number of ducks you think have blue marks. Explain your reasoning.
Problem 2
Lin wants to know if flipping a quarter really does have a probability of $\frac{1}{2}$ of landing heads up, so she flips a quarter 10 times. It lands heads up 3 times and tails up 7 times. Has she proven that the probability is not $\frac{1}{2}$? Explain your reasoning.
Problem 3
A spinner is spun 40 times for a game. Here is a graph showing the fraction of games that are wins under some conditions.
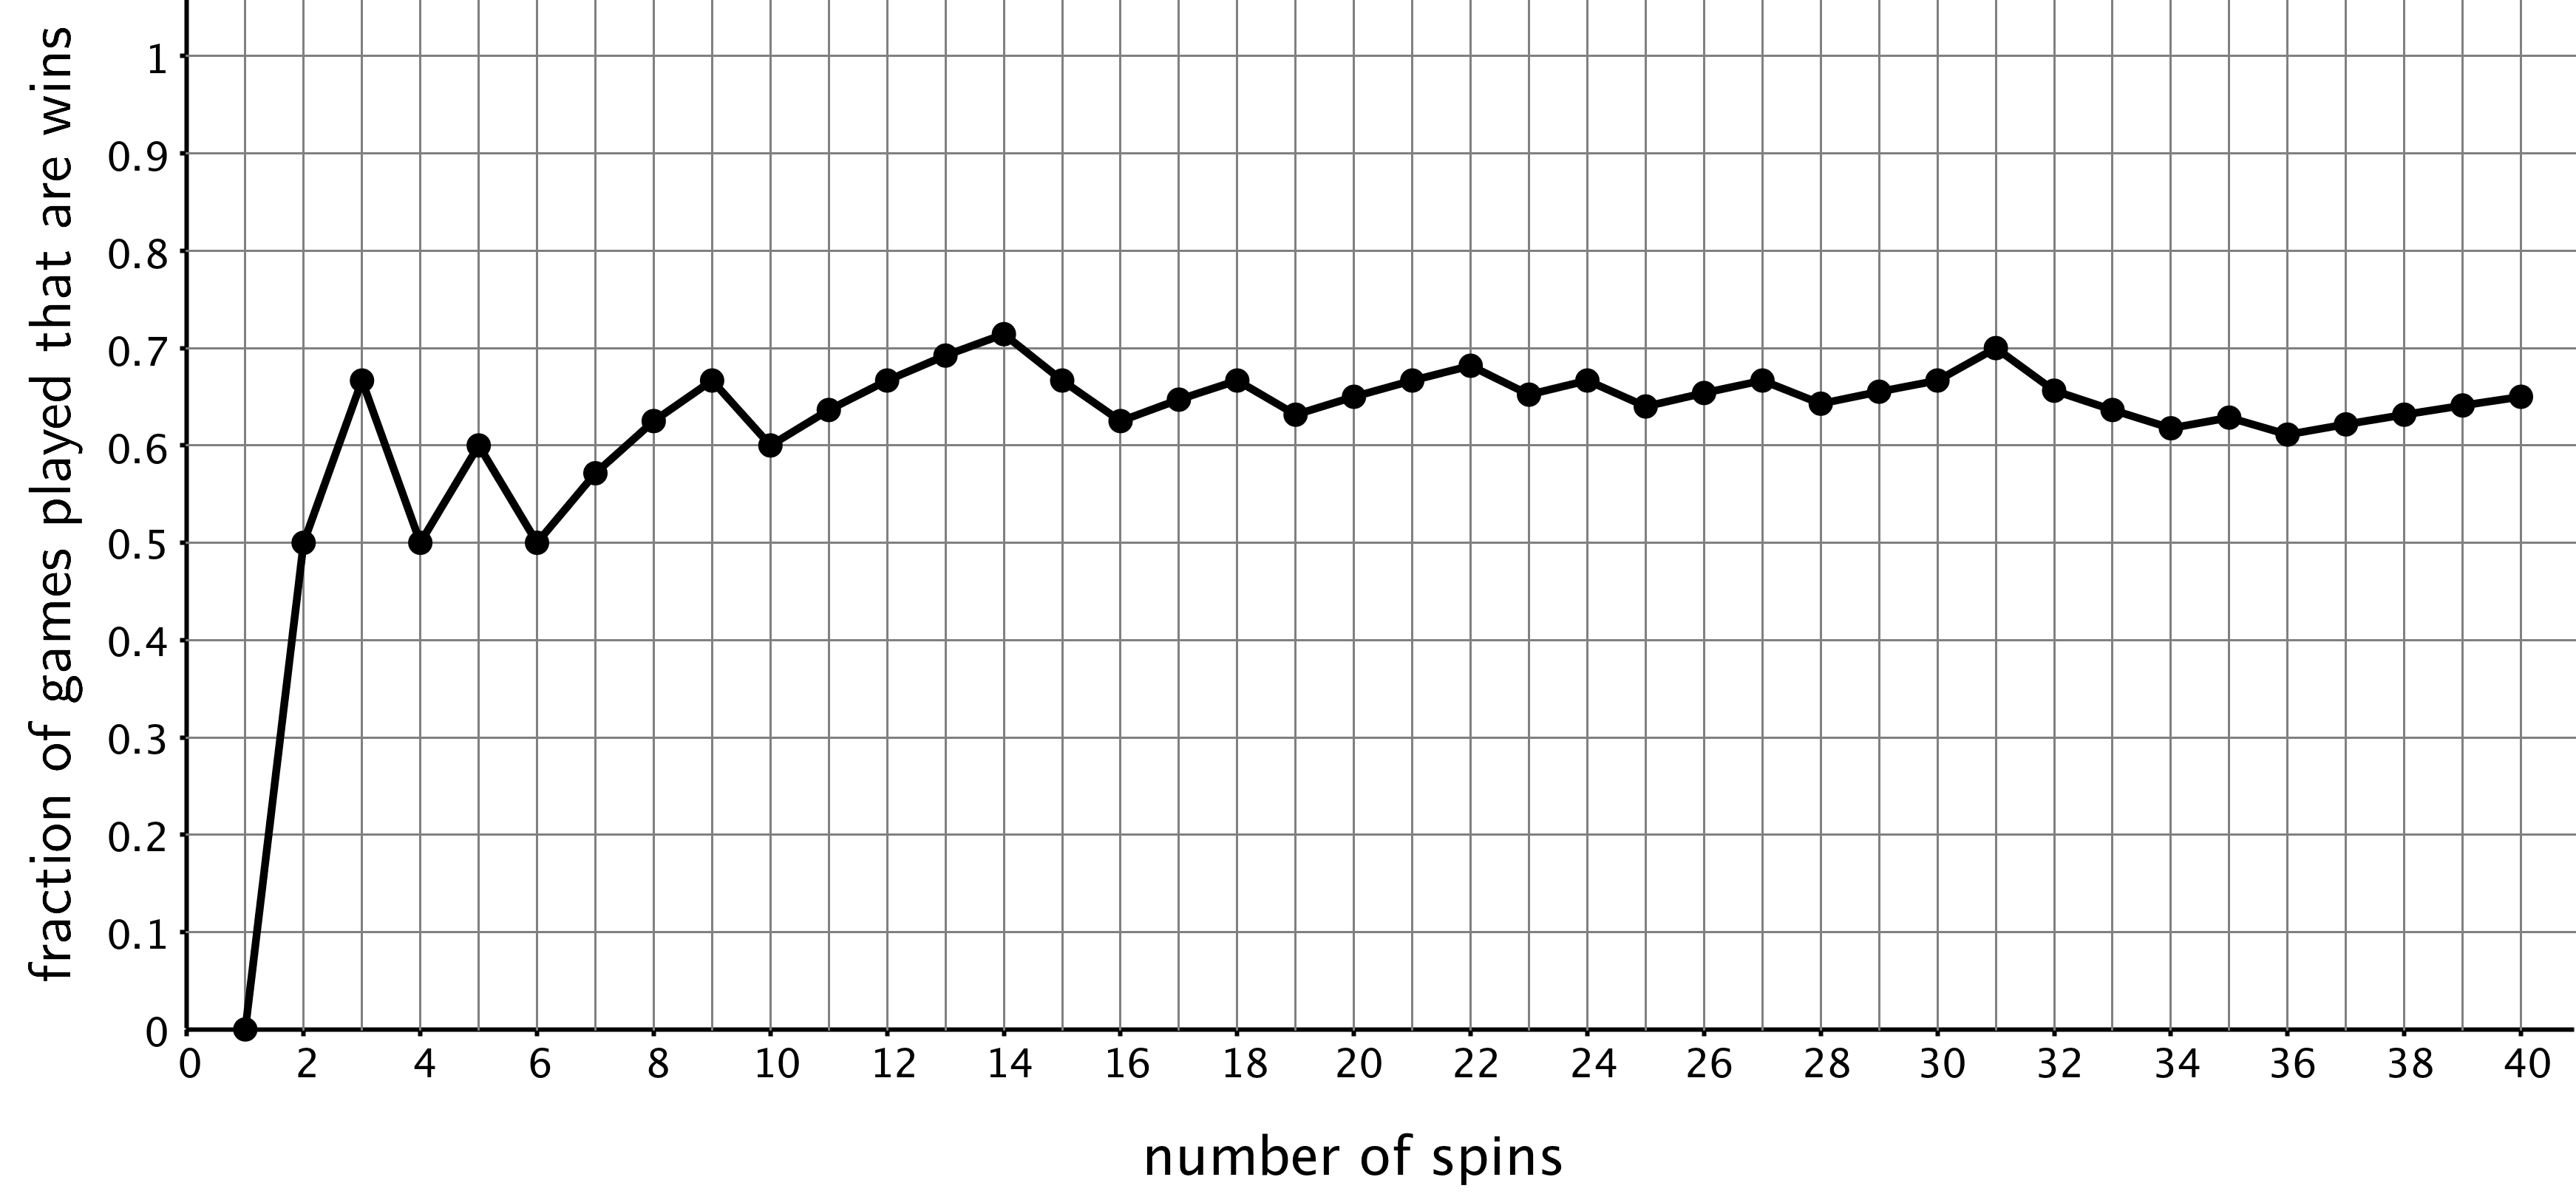
Estimate the probability of a spin winning this game based on the graph.
Problem 4 (from Unit 8, Lesson 2)
Which event is more likely: rolling a standard number cube and getting an even number, or flipping a coin and having it land heads up?
Problem 5 (from Unit 8, Lesson 3)
Noah will select a letter at random from the word “FLUTE.” Lin will select a letter at random from the word “CLARINET.”
Which person is more likely to pick the letter “E?” Explain your reasoning.
Lesson 5
Problem 1
What is the same about these two experiments? What is different?
-
Selecting a letter at random from the word “ALABAMA”
-
Selecting a letter at random from the word “LAMB”
Problem 2
Andre picks a block out of a bag 60 times and notes that 43 of them were green.
- What should Andre estimate for the probability of picking out a green block from this bag?
- Mai looks in the bag and sees that there are 6 blocks in the bag. Should Andre change his estimate based on this information? If so, what should the new estimate be? If not, explain your reasoning.
Problem 3
A person suspects a standard number cube is not so standard. He rolls it 100 times, and it lands on a six 40 times. Another person rolls this cube 100 times, and it lands on a six 42 times. A third person rolls the cube 100 times, and it lands on a six 33 times. Based on the results, is there evidence to help prove that this cube is not a standard number cube? Explain your reasoning.
Problem 4 (from Unit 8, Lesson 3)
A textbook has 428 pages numbered in order starting with 1. You flip to a random page in the book in a way that it is equally likely to stop at any of the pages.
- What is the sample space for this experiment?
- What is the probability that you turn to page 45?
- What is the probability that you turn to an even numbered page?
Problem 5 (from Unit 7, Lesson 15)
A rectangular prism is cut along a diagonal on each face to create two triangular prisms. The distance between $A$ and $B$ is 5 inches.
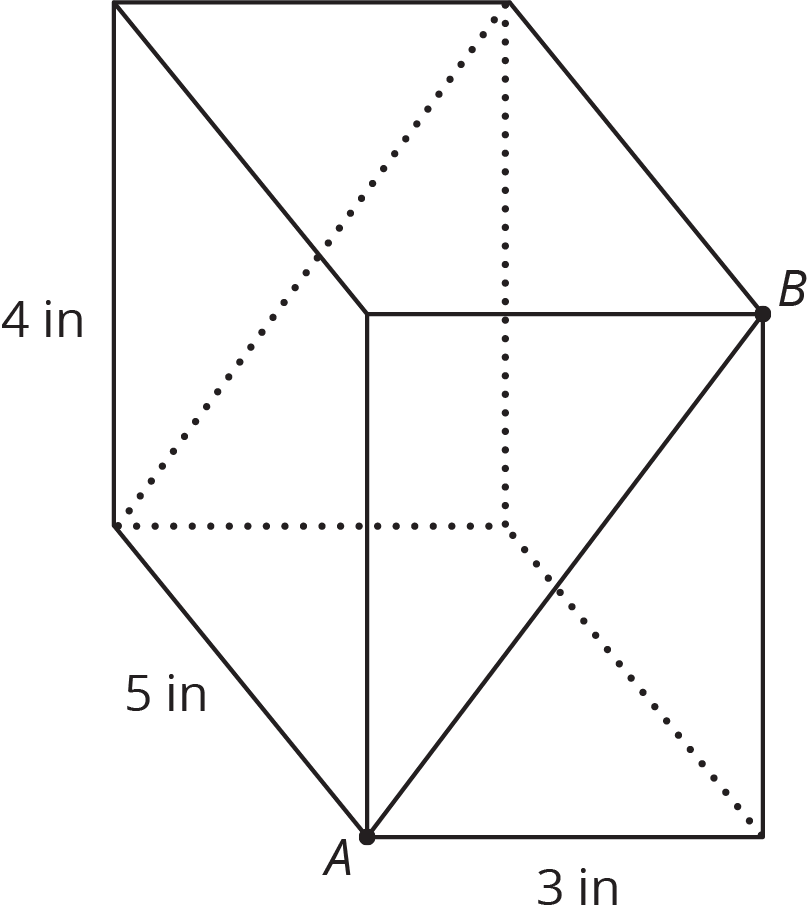
What is the surface area of the original rectangular prism? What is the total surface area of the two triangular prisms together?
Lesson 6
Problem 1
The weather forecast says there is a 75% chance it will rain later today.
-
Draw a spinner you could use to simulate this probability.
-
Describe another way you could simulate this probability.
Problem 2
An experiment will produce one of ten different outcomes with equal probability for each. Why would using a standard number cube to simulate the experiment be a bad choice?
Problem 3
An ice cream shop offers 40 different flavors. To simulate the most commonly chosen flavor, you could write the name of each flavor on a piece of paper and put it in a bag. Draw from the bag 100 times, and see which flavor is chosen the most. Why is this simulation a bad way to figure out the most commonly chosen flavor?
Problem 4 (from Unit 7, Lesson 7)
Each set of three numbers represents the lengths, in units, of the sides of a triangle. Which set can not be used to make a triangle?
- 7, 6, 14
- 4, 4, 4
- 6, 6, 2
-
7, 8,13
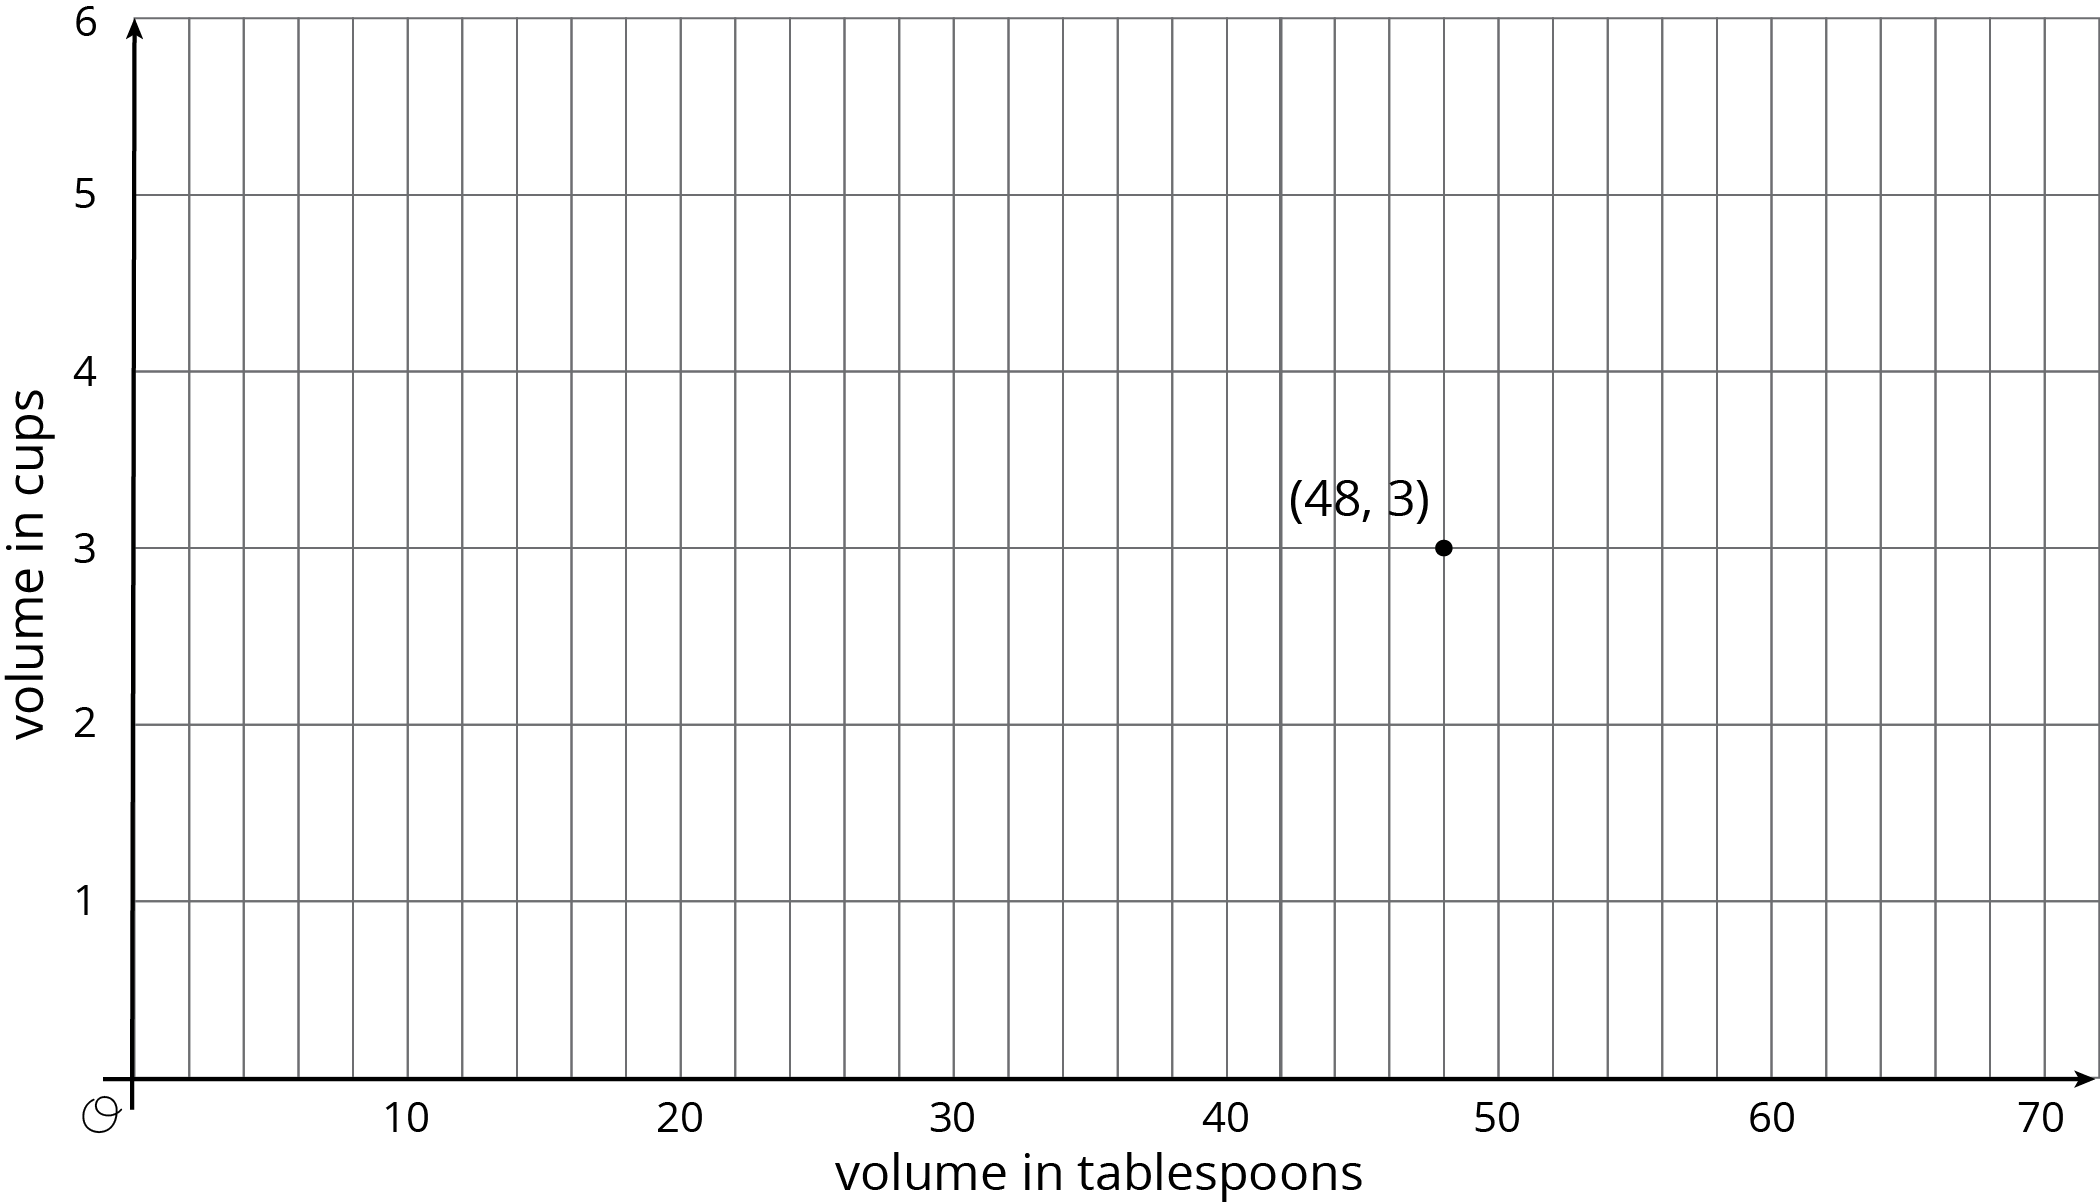
Problem 5 (from Unit 2, Lesson 14)
There is a proportional relationship between a volume measured in cups and the same volume measured in tablespoons. 48 tablespoons is equivalent to 3 cups, as shown in the graph.
- Plot and label some more points that represent the relationship.
- Use a straightedge to draw a line that represents this proportional relationship.
- For which value $y$ is ($1, y$) on the line you just drew?
- What is the constant of proportionality for this relationship?
- Write an equation representing this relationship. Use $c$ for cups and $t$ for tablespoons.
Lesson 7
Problem 1
Priya’s cat is pregnant with a litter of 5 kittens. Each kitten has a 30% chance of being chocolate brown. Priya wants to know the probability that at least two of the kittens will be chocolate brown.
To simulate this, Priya put 3 white cubes and 7 green cubes in a bag. For each trial, Priya pulled out and returned a cube 5 times. Priya conducted 12 trials. Here is a table with the results.
| trial number | outcome |
|---|---|
| 1 | ggggg |
| 2 | gggwg |
| 3 | wgwgw |
| 4 | gwggg |
| 5 | gggwg |
| 6 | wwggg |
| 7 | gwggg |
| 8 | ggwgw |
| 9 | wwwgg |
| 10 | ggggw |
| 11 | wggwg |
| 12 | gggwg |
-
How many successful trials were there? Describe how you determined if a trial was a success.
-
Based on this simulation, estimate the probability that exactly two kittens will be chocolate brown.
-
Based on this simulation, estimate the probability that at least two kittens will be chocolate brown.
-
Write and answer another question Priya could answer using this simulation.
-
How could Priya increase the accuracy of the simulation?
Problem 2
A team has a 75% chance to win each of the 3 games they will play this week. Clare simulates the week of games by putting 4 pieces of paper in a bag, 3 labeled “win” and 1 labeled “lose.” She draws a paper, writes down the result, then replaces the paper and repeats the process two more times. Clare gets the result: win, win, lose. What can Clare do to estimate the probability the team will win at least 2 games?
Problem 3 (from Unit 8, Lesson 5)
- List the sample space for selecting a letter a random from the word “PINEAPPLE.”
- A letter is randomly selected from the word “PINEAPPLE.” Which is more likely, selecting “E” or selecting “P?” Explain your reasoning.
Problem 4 (from Unit 2, Lesson 11)
On a graph of side length of a square vs. its perimeter, a few points are plotted.
- Add at least two more ordered pairs to the graph.
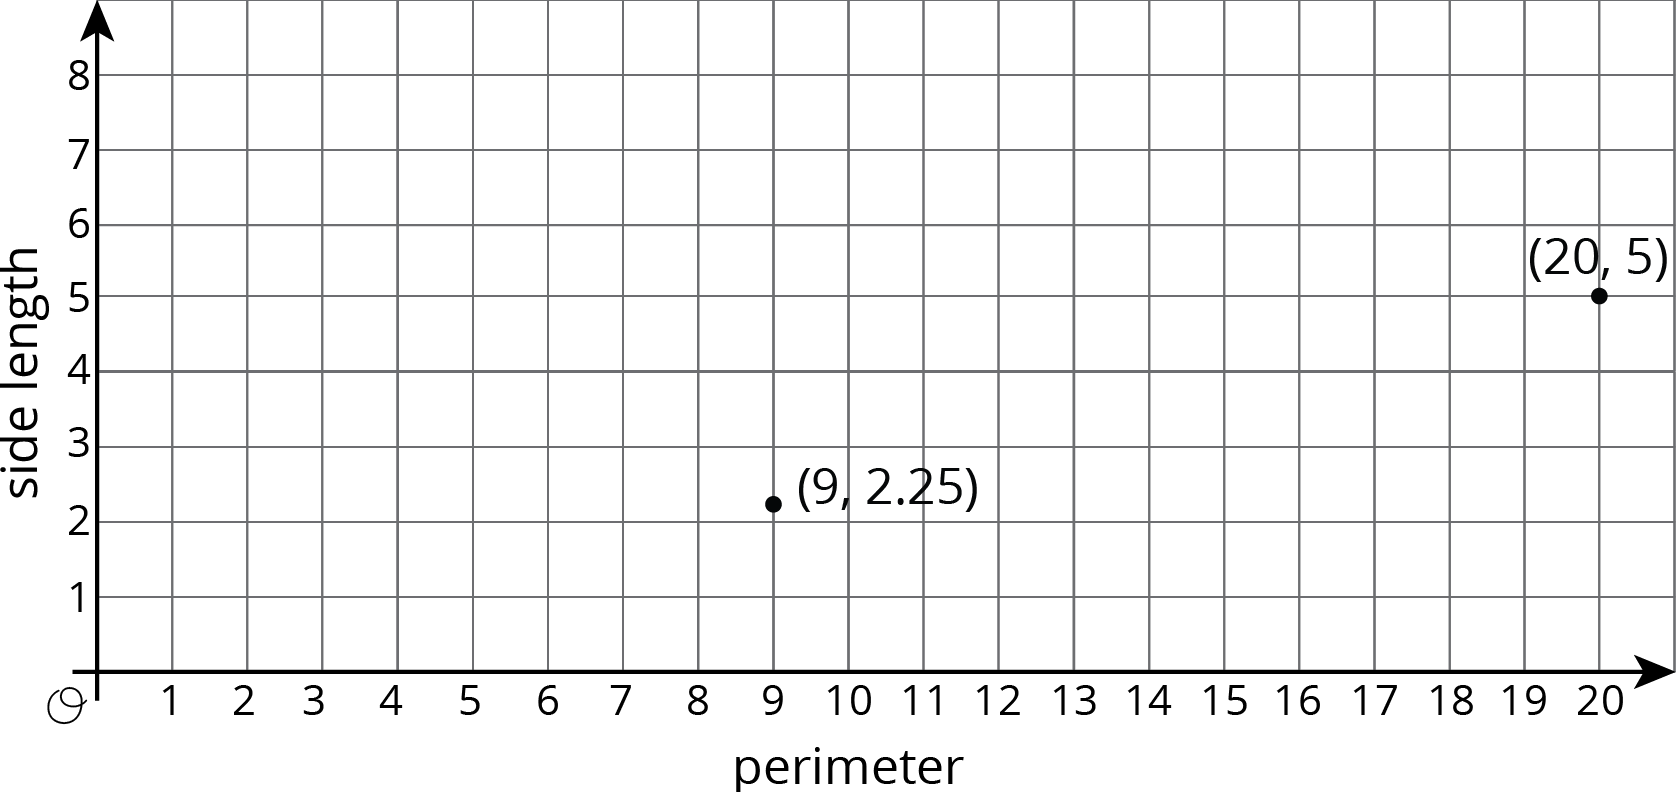
- Is there a proportional relationship between the perimeter and side length? Explain how you know.
Lesson 8
Problem 1
Noah is planning his birthday party. Here is a tree showing all of the possible themes, locations, and days of the week that Noah is considering.
-
How many themes is Noah considering?
-
How many locations is Noah considering?
-
How many days of the week is Noah considering?
-
One possibility that Noah is considering is a party with a space theme at the skating rink on Sunday. Write two other possible parties Noah is considering.
-
How many different possible outcomes are in the sample space?

Problem 2
For each event, write the sample space and tell how many outcomes there are.
-
Lin selects one type of lettuce and one dressing to make a salad.
-
Lettuce types: iceberg, romaine
-
Dressings: ranch, Italian, French
-
-
Diego chooses rock, paper, or scissors, and Jada chooses rock, paper, or scissors.
-
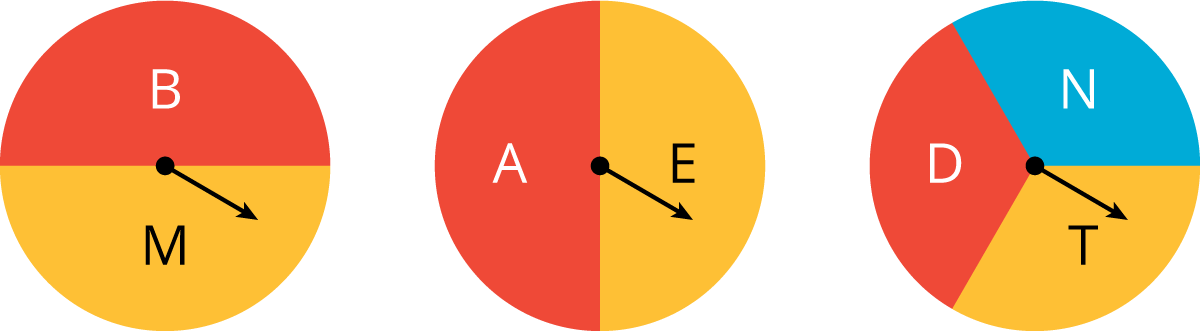
Spin these 3 spinners.
Problem 3 (from Unit 8, Lesson 7)
A simulation is done to represent kicking 5 field goals in a single game with a 72% probability of making each one. A 1 represents making the kick and a 0 represents missing the kick.
| trial | result | |
|---|---|---|
| row 1 | 1 | 10101 |
| row 2 | 2 | 11010 |
| row 3 | 3 | 00011 |
| row 4 | 4 | 11111 |
| row 5 | 5 | 10011 |
Based on these results, estimate the probability that 3 or more kicks are made.
Problem 4 (from Unit 8, Lesson 4)
There is a bag of 50 marbles.
- Andre takes out a marble, records its color, and puts it back in. In 4 trials, he gets a green marble 1 time.
- Jada takes out a marble, records its color, and puts it back in. In 12 trials, she gets a green marble 5 times.
- Noah takes out a marble, records its color, and puts it back in. In 9 trials, he gets a green marble 3 times.
Estimate the probability of getting a green marble from this bag. Explain your reasoning.
Lesson 9
Problem 1
A vending machine has 5 colors (white, red, green, blue, and yellow) of gumballs and an equal chance of dispensing each. A second machine has 4 different animal-shaped rubber bands (lion, elephant, horse, and alligator) and an equal chance of dispensing each. If you buy one item from each machine, what is the probability of getting a yellow gumball and a lion band?
Problem 2
The numbers 1 through 10 are put in one bag. The numbers 5 through 14 are put in another bag. When you pick one number from each bag, what is the probability you get the same number?
Problem 3
When rolling 3 standard number cubes, the probability of getting all three numbers to match is $\frac{6}{216}$. What is the probability that the three numbers do not all match? Explain your reasoning.
Problem 4 (from Unit 8, Lesson 8)
For each event, write the sample space and tell how many outcomes there are.
-
Roll a standard number cube. Then flip a quarter.
-
Select a month. Then select 2020 or 2025.
Problem 5 (from Unit 2, Lesson 11)
On a graph of the area of a square vs. its perimeter, a few points are plotted.
- Add some more ordered pairs to the graph.
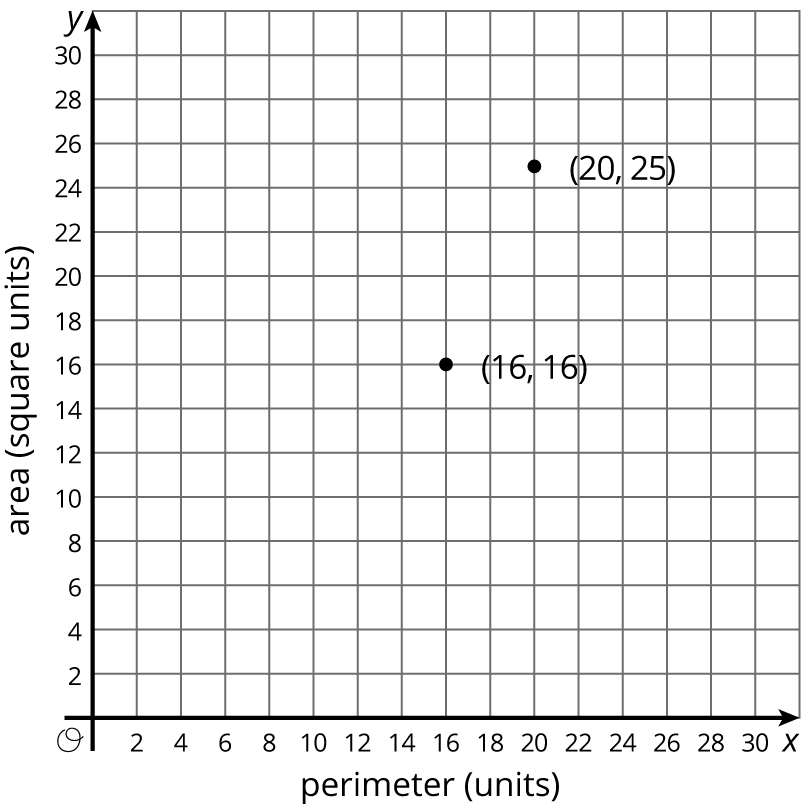
- Is there a proportional relationship between the area and perimeter of a square? Explain how you know.
Lesson 10
Problem 1
A rare and delicate plant will only produce flowers from 10% of the seeds planted. To see if it is worth planting 5 seeds to see any flowers, the situation is going to be simulated. Which of these options is the best simulation? For the others, explain why it is not a good simulation.
- Another plant can be genetically modified to produce flowers 10% of the time. Plant 30 groups of 5 seeds each and wait 6 months for the plants to grow and count the fraction of groups that produce flowers.
- Roll a standard number cube 5 times. Each time a 6 appears, it represents a plant producing flowers. Repeat this process 30 times and count the fraction of times at least one number 6 appears.
- Have a computer produce 5 random digits (0 through 9). If a 9 appears in the list of digits, it represents a plant producing flowers. Repeat this process 300 times and count the fraction of times at least one number 9 appears.
- Create a spinner with 10 equal sections and mark one of them “flowers.” Spin the spinner 5 times to represent the 5 seeds. Repeat this process 30 times and count the fraction of times that at least 1 “flower” was spun.
Problem 2 (from Unit 7, Lesson 13)
The figure on the left is a trapezoidal prism. The figure on the right represents its base. Find the volume of this prism.

Problem 3
Jada and Elena learned that 8% of students have asthma. They want to know the probability that in a team of 4 students, at least one of them has asthma. To simulate this, they put 25 slips of paper in a bag. Two of the slips say “asthma.” Next, they take four papers out of the bag and record whether at least one of them says “asthma.” They repeat this process 15 times.
-
Jada says they could improve the accuracy of their simulation by using 100 slips of paper and marking 8 of them.
-
Elena says they could improve the accuracy of their simulation by conducting 30 trials instead of 15.
-
Do you agree with either of them? Explain your reasoning.
-
Describe another method of simulating the same scenario.
Problem 4 (from Unit 6, Lesson 22)
Match each expression in the first list with an equivalent expression from the second list.
- $(8x+6y) + (2x+4y)$
- $(8x+6y) - (2x+4y)$
- $(8x+6y) - (2x-4y)$
- $8x-6y - 2x+ 4y$
- $8x-6y + 2x- 4y$
- $8x-(\text-6y - 2x+4y)$
- $10(x+y)$
- $10(x-y)$
- $6(x-\frac13y)$
- $8x+6y+2x-4y$
- $8x+6y-2x+4y$
- $8x-2x+6y-4y$
Lesson 11
Problem 1
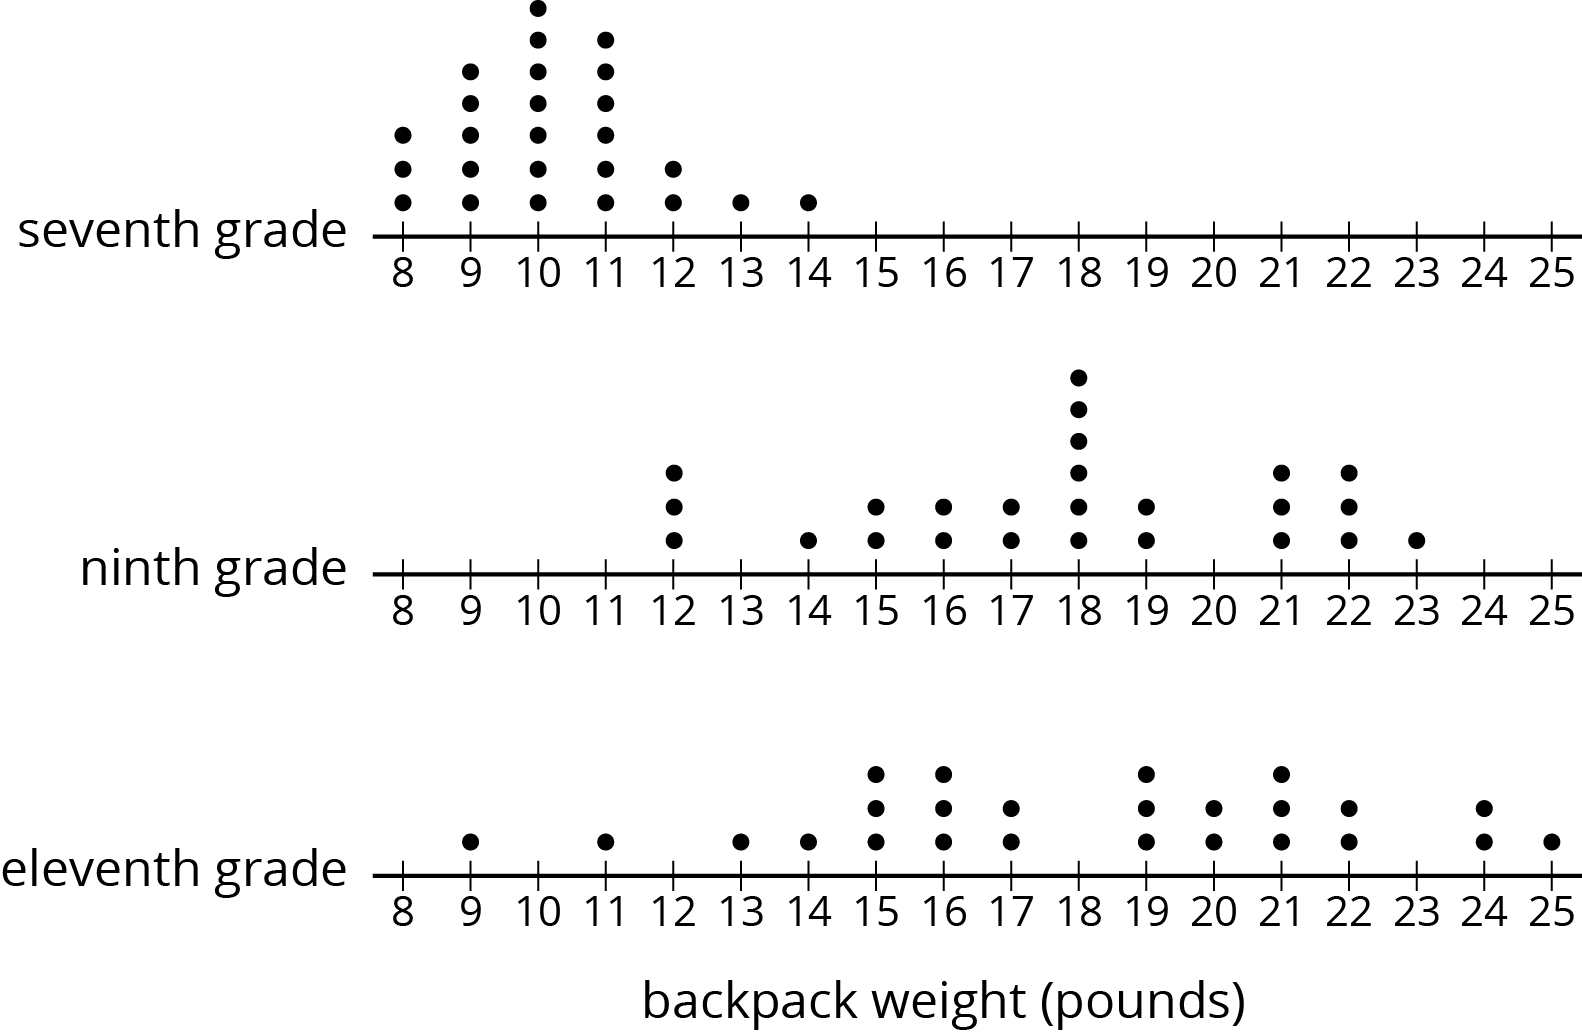
Compare the weights of the backpacks for the students in these three classes.
Problem 2 (from Unit 4, Lesson 11)
A bookstore has marked down the price for all the books in a certain series by 15%.
- How much is the discount on a book that normally costs \$18.00?
- After the discount, how much would the book cost?
Problem 3 (from Unit 6, Lesson 22)
Match each expression in List A with an equivalent expression from List B.
List A:
- $6(x+2y) - 2(y-2x)$
- $2.5(2x+4y) - 5(4y-x)$
- $7.9(5x+3y) - 4.2(5x +3y) - 1.7(5x +3y)$
- $4(5x-3y) - 10x + 6y$
- $5.5(x+y) - 2(x+y) + 6.5(x+y)$
List B:
- $10(x-y)$
- $10(x+y)$
- $10x+6y$
- $10x-6y$
Problem 4 (from Unit 7, Lesson 2)
Angles $C$ and $D$ are complementary. The ratio of the measure of Angle $C$ to the measure of Angle $D$ is $2:3$. Find the measure of each angle. Explain or show your reasoning.
Lesson 12
Problem 1
Suppose you are interested in learning about how much time seventh grade students at your school spend outdoors on a typical school day.
Select all the samples that are a part of the population you are interested in.
-
The 20 students in a seventh grade math class.
-
The first 20 students to arrive at school on a particular day.
-
The seventh grade students participating in a science fair put on by the four middle schools in a school district.
-
The 10 seventh graders on the school soccer team.
-
The students on the school debate team.
Problem 2
For each sample given, list two possible populations they could belong to.
- Sample: The prices for apples at two stores near your house.
- Sample: The days of the week the students in your math class ordered food during the past week.
- Sample: The daily high temperatures for the capital cities of all 50 U.S. states over the past year.
Problem 3 (from Unit 8, Lesson 11)
A school’s art club holds a bake sale on Fridays to raise money for art supplies. Here are the number of cookies they sold each week in the fall and in the spring:
| fall | 20 | 26 | 25 | 24 | 29 | 20 | 19 | 19 | 24 | 24 |
|---|---|---|---|---|---|---|---|---|---|---|
| spring | 19 | 27 | 29 | 21 | 25 | 22 | 26 | 21 | 25 | 25 |
-
Find the mean number of cookies sold in the fall and in the spring.
-
The MAD for the fall data is 2.8 cookies. The MAD for the spring data is 2.6 cookies. Express the difference in means as a multiple of the larger MAD.
-
Based on this data, do you think that sales were generally higher in the spring than in the fall?
Problem 4 (from Unit 8, Lesson 9)
If 6 coins are flipped, find the probability that there is at least 1 heads.
Problem 5 (from Unit 4, Lesson 11)
A school is selling candles for a fundraiser. They keep 40% of the total sales as their commission, and they pay the rest to the candle company.
| row 1 | price of candle | number of candles sold |
|---|---|---|
| row 2 | small candle: \$11 | 68 |
| row 3 | medium candle: \$18 | 45 |
| row 4 | large candle: \$25 | 21 |
How much money must the school pay to the candle company?
Lesson 13
Problem 1
Suppose 45% of all the students at Andre’s school brought in a can of food to contribute to a canned food drive. Andre picks a representative sample of 25 students from the school and determines the sample’s percentage.
He expects the percentage for this sample will be 45%. Do you agree? Explain your reasoning.
Problem 2
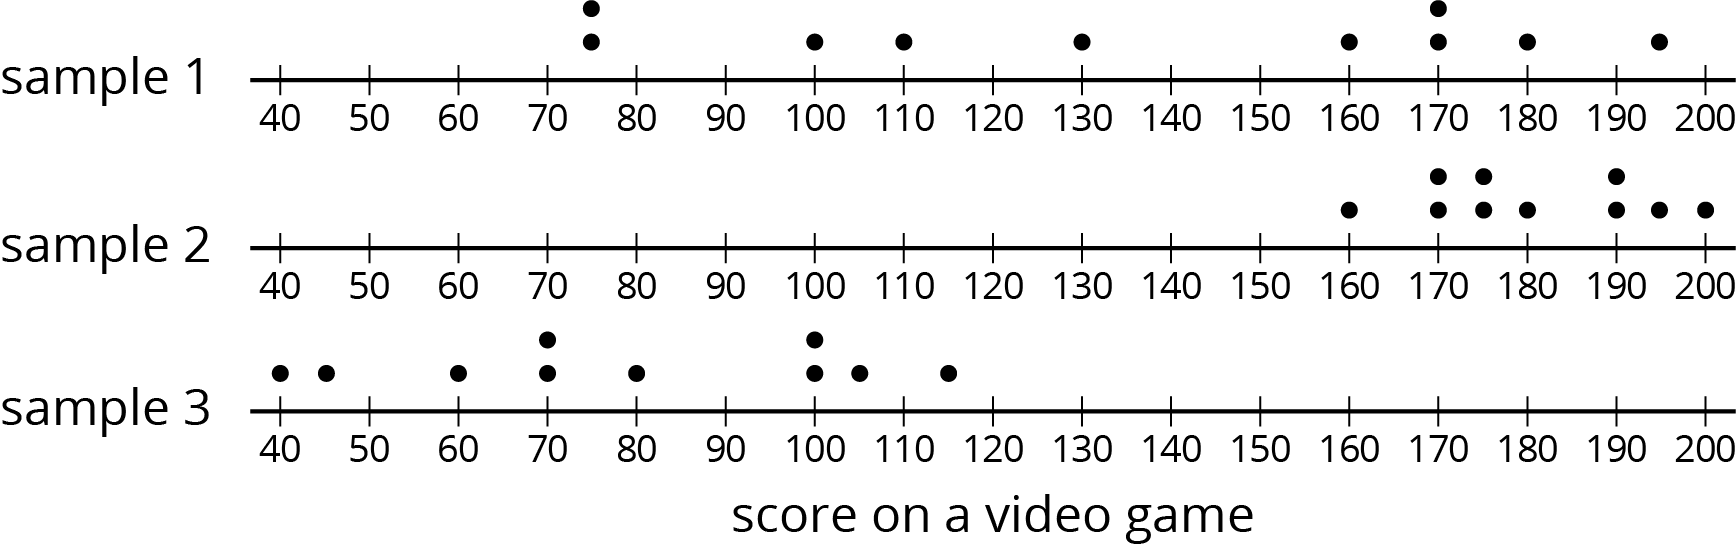
This is a dot plot of the scores on a video game for a population of 50 teenagers.
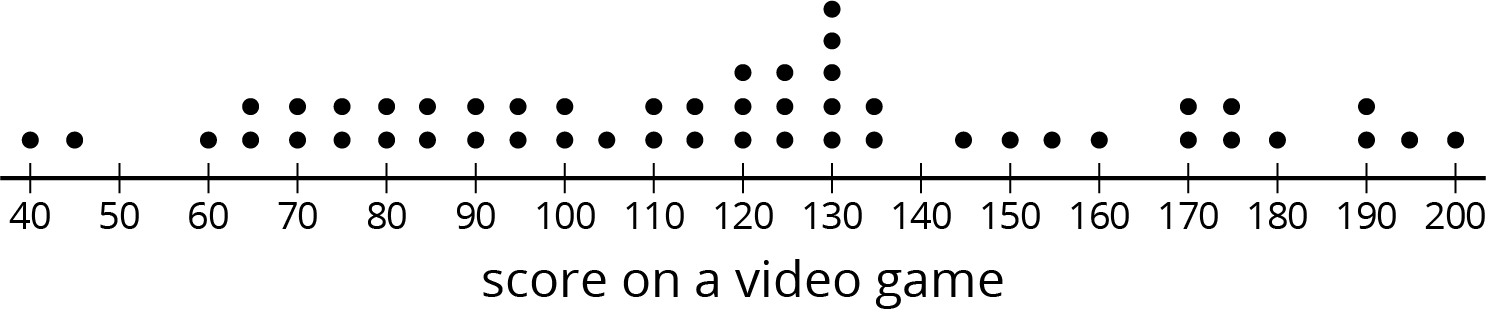
The three dot plots together are the scores of teenagers in three samples from this population. Which of the three samples is most representative of the population? Explain how you know.
Problem 3
This is a dot plot of the number of text messages sent one day for a sample of the students at a local high school. The sample consisted of 30 students and was selected to be representative of the population.
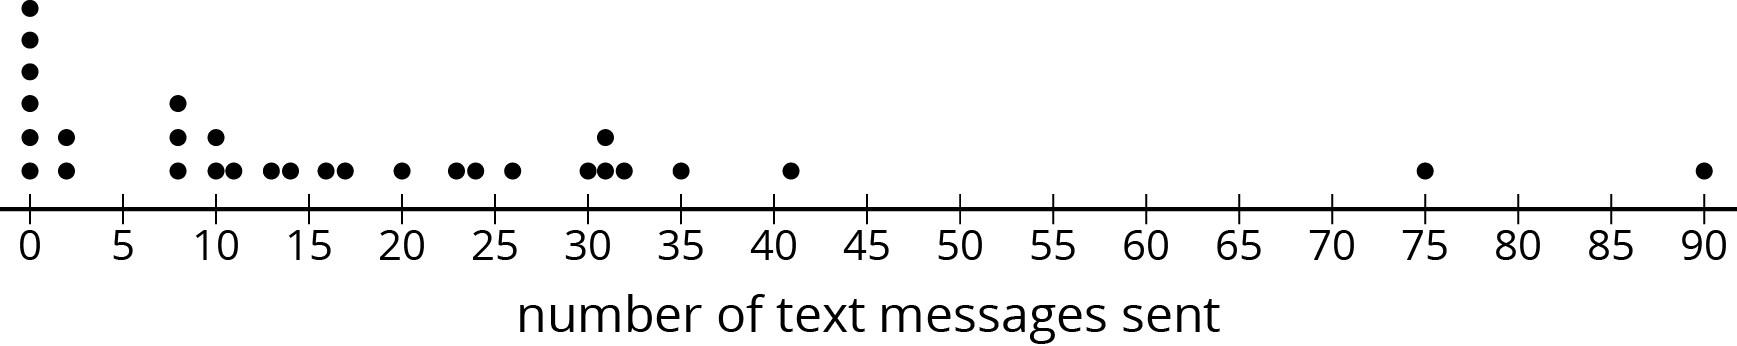
-
What do the five values of 0 in the dot plot represent?
-
Since this sample is representative of the population, describe what you think a dot plot for the entire population might look like.
Problem 4 (from Unit 8, Lesson 12)
A doctor suspects you might have a certain strain of flu and wants to test your blood for the presence of markers for this strain of virus. Why would it be good for the doctor to take a sample of your blood rather than use the population?
Problem 5 (from Unit 8, Lesson 8)
How many different outcomes are in each sample space? Explain your reasoning.
(You do not need to write out the actual options, just provide the number and your reasoning.)
-
A letter of the English alphabet is followed by a digit from 0 to 9.
-
A baseball team’s cap is selected from 3 different colors, 2 different clasps, and 4 different locations for the team logo. A decision is made to include or not to include reflective piping.
-
A locker combination like 7-23-11 uses three numbers, each from 1 to 40. Numbers can be used more than once, like 7-23-7.
Lesson 14
Problem 1
The meat department manager at a grocery store is worried some of the packages of ground beef labeled as having one pound of meat may be under-filled. He decides to take a sample of 5 packages from a shipment containing 100 packages of ground beef. The packages were numbered as they were put in the box, so each one has a different number between 1 and 100.
Describe how the manager can select a fair sample of 5 packages.
Problem 2
Select all the reasons why random samples are preferred over other methods of getting a sample.
-
If you select a random sample, you can determine how many people you want in the sample.
-
A random sample is always the easiest way to select a sample from a population.
-
A random sample is likely to give you a sample that is representative of the population.
-
A random sample is a fair way to select a sample, because each person in the population has an equal chance of being selected.
-
If you use a random sample, the sample mean will always be the same as the population mean.
Problem 3
Jada is using a computer’s random number generator to produce 6 random whole numbers between 1 and 100 so she can use a random sample. The computer produces the numbers: 1, 2, 3, 4, 5, and 6. Should she use these numbers or have the computer generate a new set of random numbers? Explain your reasoning.
Problem 4 (from Unit 8, Lesson 6)
A group of 100 people is divided into 5 groups with 20 people in each. One person’s name is chosen, and everyone in their group wins a prize. Noah simulates this situation by writing 100 different names on papers and putting them in a bag, then drawing one out. Kiran suggests there is a way to do it with fewer paper slips. Explain a method that would simulate this situation with fewer than 100 slips of paper.
Problem 5 (from Unit 8, Lesson 12)
Data collected from a survey of American teenagers aged 13 to 17 was used to estimate that 29% of teens believe in ghosts. This estimate was based on data from 510 American teenagers. What is the population that people carrying out the survey were interested in?
-
All people in the United States.
-
The 510 teens that were surveyed.
-
All American teens who are between the ages of 13 and 17.
-
The 29% of the teens surveyed who said they believe in ghosts.
Problem 6 (from Unit 8, Lesson 7)
A computer simulates flipping a coin 100 times, then counts the longest string of heads in a row.
| trial | most heads in a row | |
|---|---|---|
| row 1 | 1 | 8 |
| row 2 | 2 | 6 |
| row 3 | 3 | 5 |
| row 4 | 4 | 11 |
| row 5 | 5 | 13 |
Based on these results, estimate the probability that there will be at least 15 heads in a row.
Lesson 15
Problem 1
A random sample of 15 items were selected.

For this data set, is the mean or median a better measure of center? Explain your reasoning.
Problem 2
A video game developer wants to know how long it takes people to finish playing their new game. They surveyed a random sample of 13 players and asked how long it took them (in minutes).
| 1,235 | 952 | 457 | 1,486 | 1,759 | 1,148 | 548 | 1,037 | 1,864 | 1,245 | 976 | 866 | 1,431 |
- Estimate the median time it will take all players to finish this game.
- Find the interquartile range for this sample.
Problem 3
Han and Priya want to know the mean height of the 30 students in their dance class. They each select a random sample of 5 students.
- The mean height for Han’s sample is 59 inches.
- The mean height for Priya’s sample is 61 inches.
Does it surprise you that the two sample means are different? Are the population means different? Explain your reasoning.
Problem 4
Clare and Priya each took a random sample of 25 students at their school.
- Clare asked each student in her sample how much time they spend doing homework each night. The sample mean was 1.2 hours and the MAD was 0.6 hours.
- Priya asked each student in her sample how much time they spend watching TV each night. The sample mean was 2 hours and the MAD was 1.3 hours.
-
At their school, do you think there is more variability in how much time students spend doing homework or watching TV? Explain your reasoning.
-
Clare estimates the students at her school spend an average of 1.2 hours each night doing homework. Priya estimates the students at her school spend an average of 2 hours each night watching TV. Which of these two estimates is likely to be closer to the actual mean value for all the students at their school? Explain your reasoning.
Lesson 16
Problem 1
Tyler wonders what proportion of students at his school would dye their hair blue if their parents would let them. He surveyed a random sample of 10 students at his school, and 2 of them said they would. Kiran didn’t think Tyler’s estimate was very accurate, so he surveyed a random sample of 100 students, and 17 of them said they would.
-
Based on Tyler's sample, estimate what proportion of the students would dye their hair blue.
-
Based on Kiran's sample, estimate what proportion of the students would dye their hair blue.
-
Whose estimate is more accurate? Explain how you know.
Problem 2
Han surveys a random sample of students about their favorite pasta dish served by the cafeteria and makes a bar graph of the results.
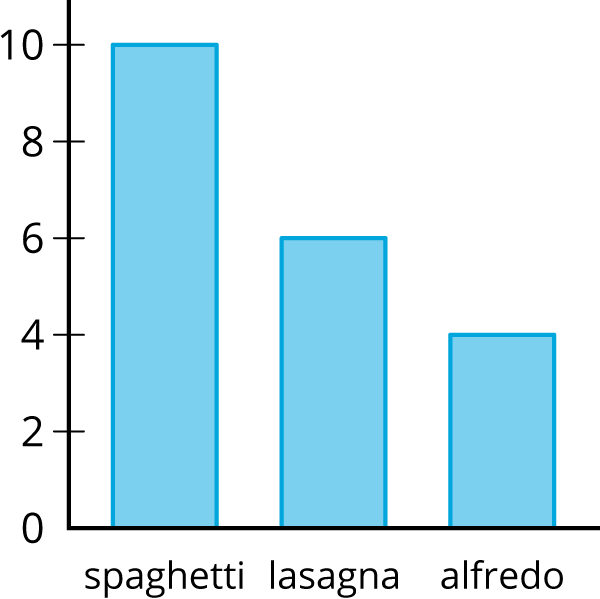
Estimate the proportion of the students who like lasagna as their favorite pasta dish.
Problem 3
Elena wants to know what proportion of people have cats as pets. Describe a process she could use to estimate an answer to her question.
Problem 4 (from Unit 8, Lesson 15)
The science teacher gives daily homework. For a random sample of days throughout the year, the median number of problems is 5 and the IQR is 2. The Spanish teacher also gives daily homework. For a random sample of days throughout the year, the median number of problems is 10 and the IQR is 1. If you estimate the median number of science homework problems to be 5 and the median number of Spanish problems to be 10, which is more likely to be accurate? Explain your reasoning.
Problem 5 (from Unit 8, Lesson 14)
Diego wants to survey a sample of students at his school to learn about the percentage of students who are satisfied with the food in the cafeteria. He decides to go to the cafeteria on a Monday and ask the first 25 students who purchase a lunch at the cafeteria if they are satisfied with the food.
Do you think this is a good way for Diego to select his sample? Explain your reasoning.
Lesson 17
Problem 1
One thousand baseball fans were asked how far they would be willing to travel to watch a professional baseball game. From this population, 100 different samples of size 40 were selected. Here is a dot plot showing the mean of each sample.
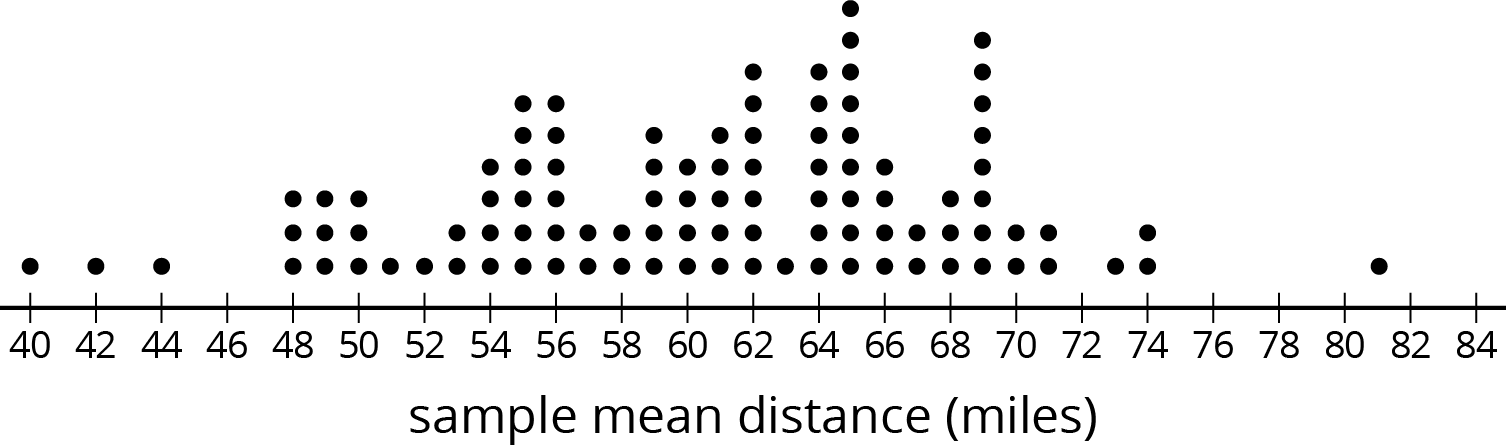
Based on the distribution of sample means, what do you think is a reasonable estimate for the mean of the population?
Problem 2
Last night, everyone at the school music concert wrote their age on a slip of paper and placed it in a box. Today, each of the students in a math class selected a random sample of size 10 from the box of papers. Here is a dot plot showing their sample means, rounded to the nearest year.
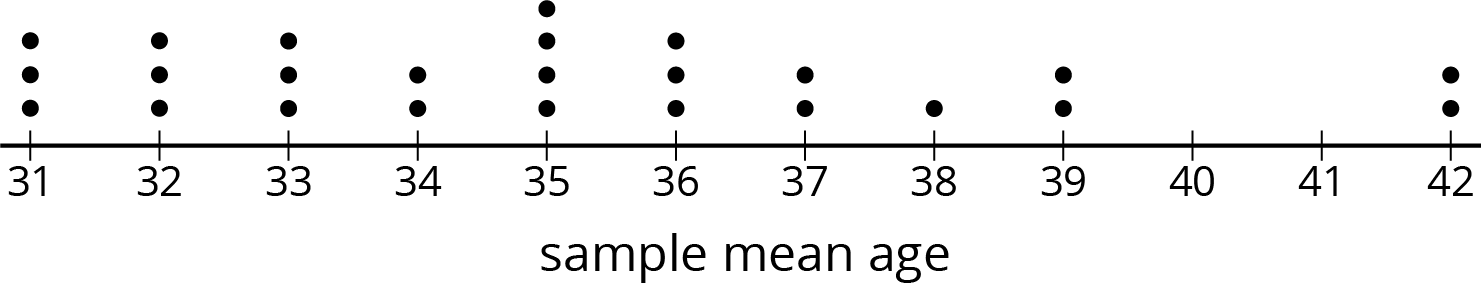
- Does the number of dots on the dot plot tell you how many people were at the concert or how many students are in the math class?
- The mean age for the population was 35 years. If Elena picks a new sample of size 10 from this population, should she expect her sample mean to be within 1 year of the population mean? Explain your reasoning.
-
What could Elena do to select a random sample that is more likely to have a sample mean within 1 year of the population mean?
Problem 3 (from Unit 8, Lesson 16)
A random sample of people were asked which hand they prefer to write with.
l means they prefer to use their left hand.
r means they prefer to use their right hand.
| l | r | r | r | r | r | r | r | r | r | l | r | r | r | r |
Based on this sample, estimate the proportion of the population that prefers to write with their left hand.
Problem 4 (from Unit 8, Lesson 15)
Andre would like to estimate the mean number of books the students at his school read over the summer break. He has a list of the names of all the students at the school, but he doesn’t have time to ask every student how many books they read.
What should Andre do to estimate the mean number of books?
Problem 5 (from Unit 8, Lesson 10)
A hockey team has a 75% chance of winning against the opposing team in each game of a playoff series. To win the series, the team must be the first to win 4 games.
- Design a simulation for this event.
- What counts as a successful outcome in your simulation?
- Estimate the probability using your simulation.
Lesson 18
Problem 1
Lin wants to know if students in elementary school generally spend more time playing outdoors than students in middle school. She selects a random sample of size 20 from each population of students and asks them how many hours they played outdoors last week. Suppose that the MAD for each of her samples is about 3 hours.
Select all pairs of sample means for which Lin could conclude there is a meaningful difference between the two populations.
-
elementary school: 12 hours, middle school: 10 hours
-
elementary school: 14 hours, middle school: 9 hours
-
elementary school: 13 hours, middle school: 6 hours
-
elementary school: 13 hours, middle school: 10 hours
-
elementary school: 7 hours, middle school: 15 hours
Problem 2
These two box plots show the distances of a standing jump, in inches, for a random sample of 10-year-olds and a random sample of 15-year-olds.

Is there is a meaningful difference in median distance for the two populations? Explain how you know.
Problem 3
The median income for a sample of people from Chicago is about \$60,000 and the median income for a sample of people from Kansas City is about \$46,000, but researchers have determined there is not a meaningful difference in the medians. Explain why the researchers might be correct.
Problem 4 (from Unit 8, Lesson 17)
A farmer grows 5,000 pumpkins each year. The pumpkins are priced according to their weight, so the farmer would like to estimate the mean weight of the pumpkins he grew this year. He randomly selects 8 pumpkins and weighs them. Here are the weights (in pounds) of these pumpkins:
| weight (pounds) | 2.9 | 6.8 | 7.3 | 7.7 | 8.9 | 10.6 | 12.3 | 15.3 |
|---|
-
Estimate the mean weight of the pumpkins the farmer grew.
This dot plot shows the mean weight of 100 samples of eight pumpkins, similar to the one above.

-
What appears to be the mean weight of the 5,000 pumpkins?
-
What does the dot plot of the sample means suggest about how accurate an estimate based on a single sample of 8 pumpkins might be?
-
What do you think the farmer might do to get a more accurate estimate of the population mean?
Lesson 19
Problem 1
An agent at an advertising agency asks a random sample of people how many episodes of a TV show they watch each day. The results are shown in the dot plot.
The agency currently advertises on a different show, but wants to change to this one as long as the typical number of episodes is not meaningfully less.
- What measure of center and measure of variation would the agent need to find for their current show to determine if there is a meaningful difference? Explain your reasoning.
- What are the values for these same characteristics for the data in the dot plot?
- What numbers for these characteristics would be meaningfully different if the measure of variability for the current show is similar? Explain your reasoning.
Problem 2
Jada wants to know if there is a meaningful difference in the mean number of friends on social media for teens and adults. She looks at the friend count for the 10 most popular of her friends and the friend count for 10 of her parents’ friends. She then computes the mean and MAD of each sample and determines there is a meaningful difference. Jada’s dad later tells her he thinks she has not come to the right conclusion. Jada checks her calculations and everything is right. Do you agree with her dad? Explain your reasoning.
Problem 3
The mean weight for a sample of a certain kind of ring made from platinum is 8.21 grams. The mean weight for a sample of a certain kind of ring made from gold is 8.61 grams. Is there a meaningful difference in the weights of the two types of rings? Explain your reasoning.
Problem 4 (from Unit 8, Lesson 15)
The lengths in feet of a random sample of 20 male and 20 female humpback whales were measured and used to create the box plot.
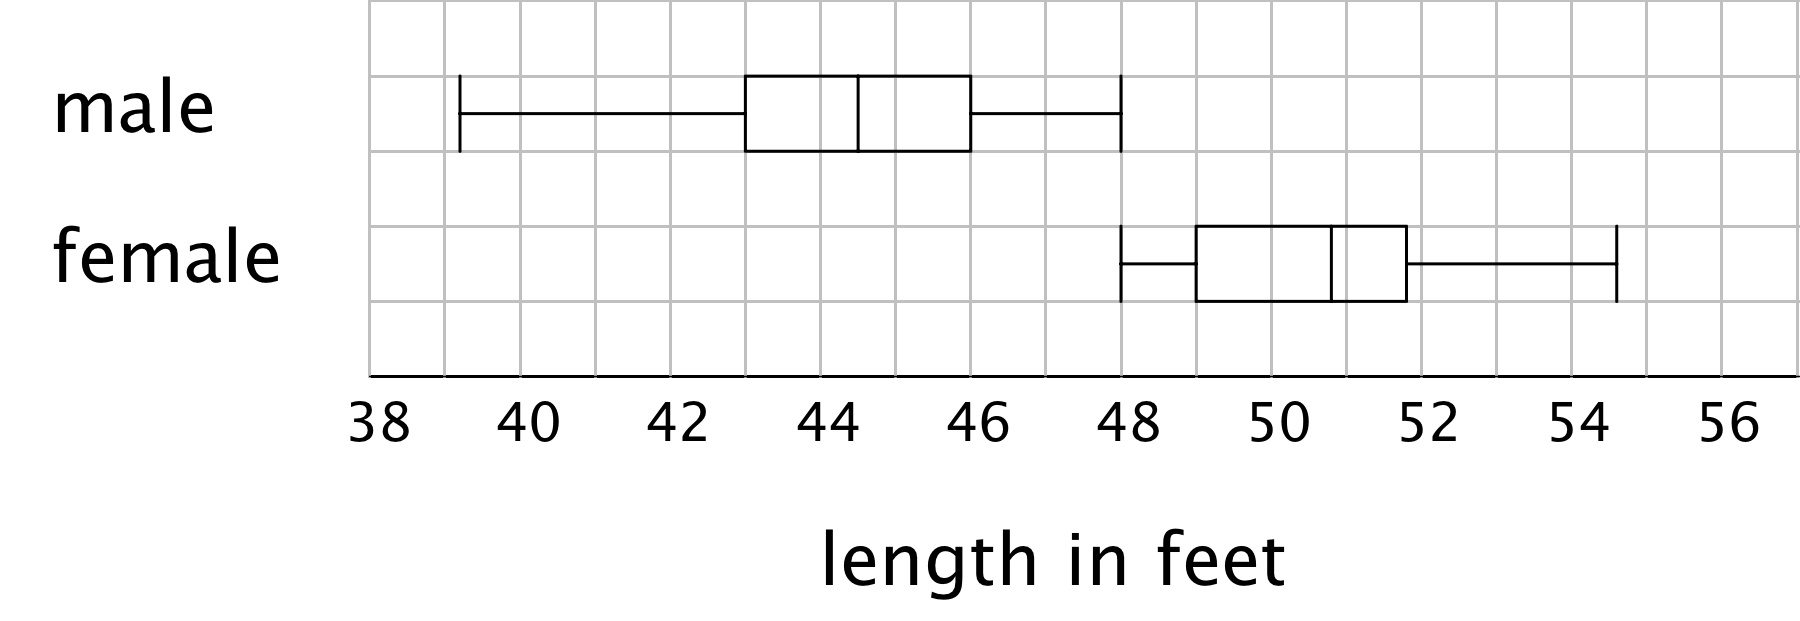
Estimate the median lengths of male and female humpback whales based on these samples.
Lesson 20
No practice problems for this lesson.