4.1: Notice and Wonder: Doubling Back
What do you notice? What do you wonder?

Let’s connect equations and graphs of functions.
What do you notice? What do you wonder?
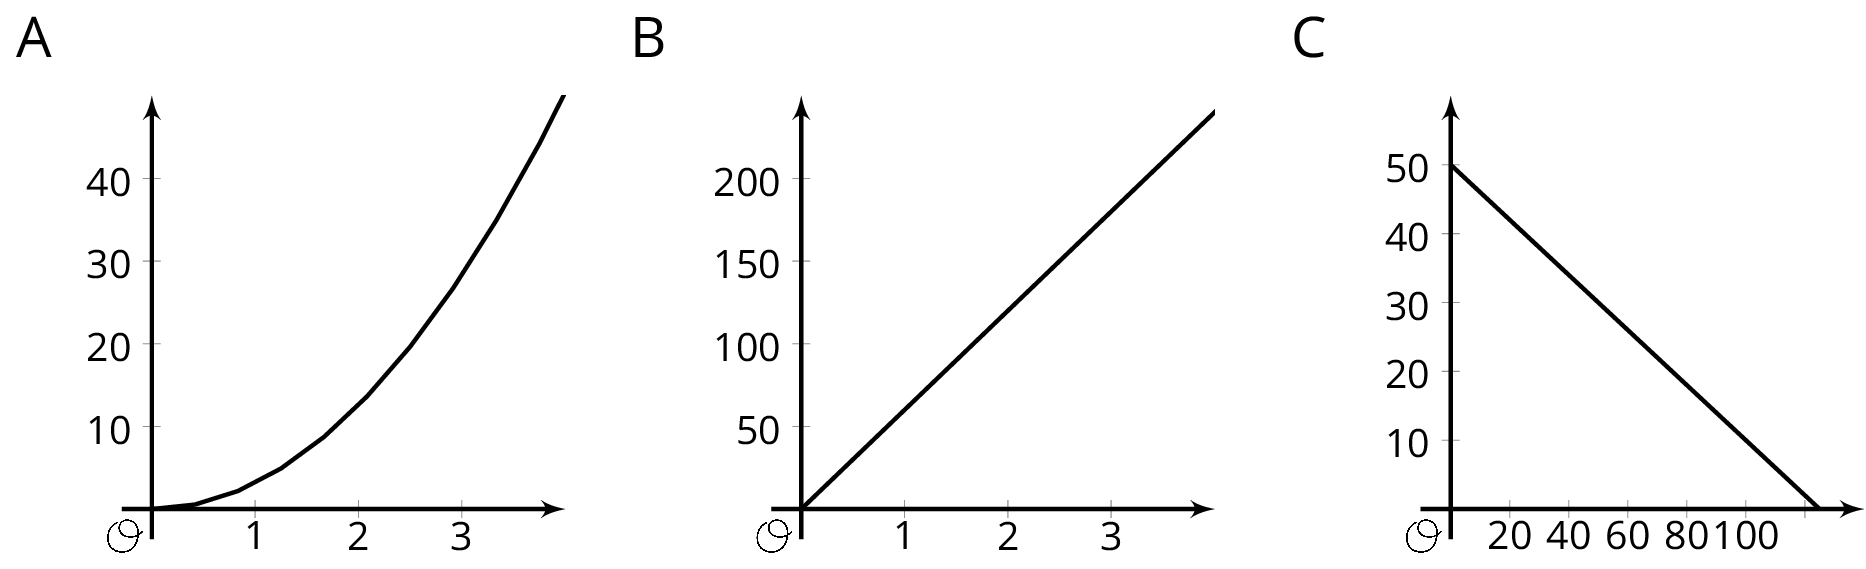
The graphs of three functions are shown.
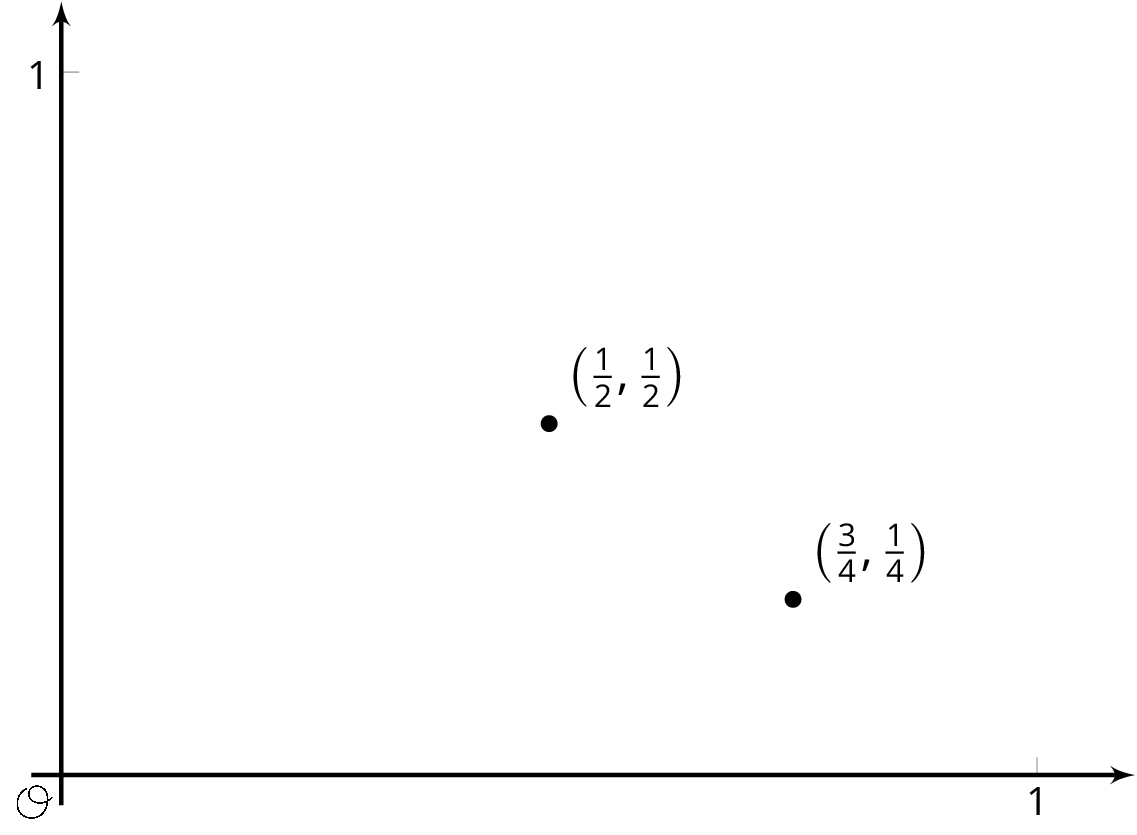
A function inputs fractions $\frac{a}{b}$ between 0 and 1 where $a$ and $b$ have no common factors, and outputs the fraction $\frac{1}{b}$. For example, given the input $\frac34$ the function outputs $\frac14$, and to the input $\frac12$ the function outputs $\frac12$. These two input-output pairs are shown on the graph.
Plot at least 10 more points on the graph of this function. Are most points on the graph above or below a height of $0.3$? Of height $0.01$?
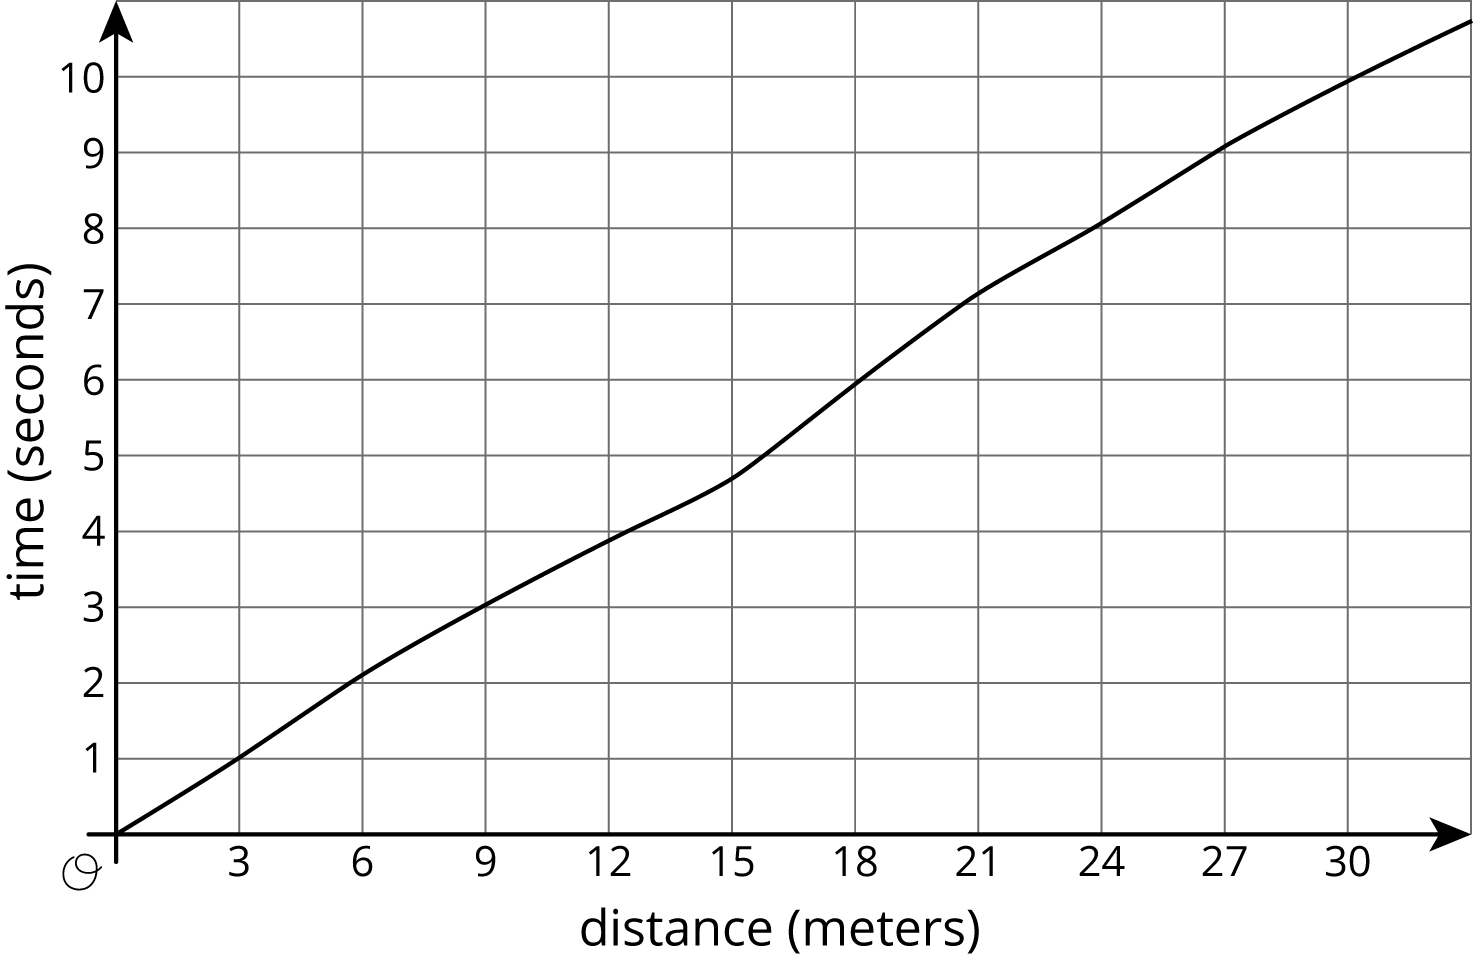
| $d$ | 0 | 3 | 6 | 9 | 12 | 15 | 18 | 21 | 24 | 27 |
|---|---|---|---|---|---|---|---|---|---|---|
| $t$ | 0 | 1.0 | 2.0 | 3.2 | 3.8 | 4.6 | 6.0 | 6.9 | 8.09 | 9.0 |
Priya is running once around the track. The graph shows her time given how far she is from her starting point.
Here is the graph showing Noah's run.
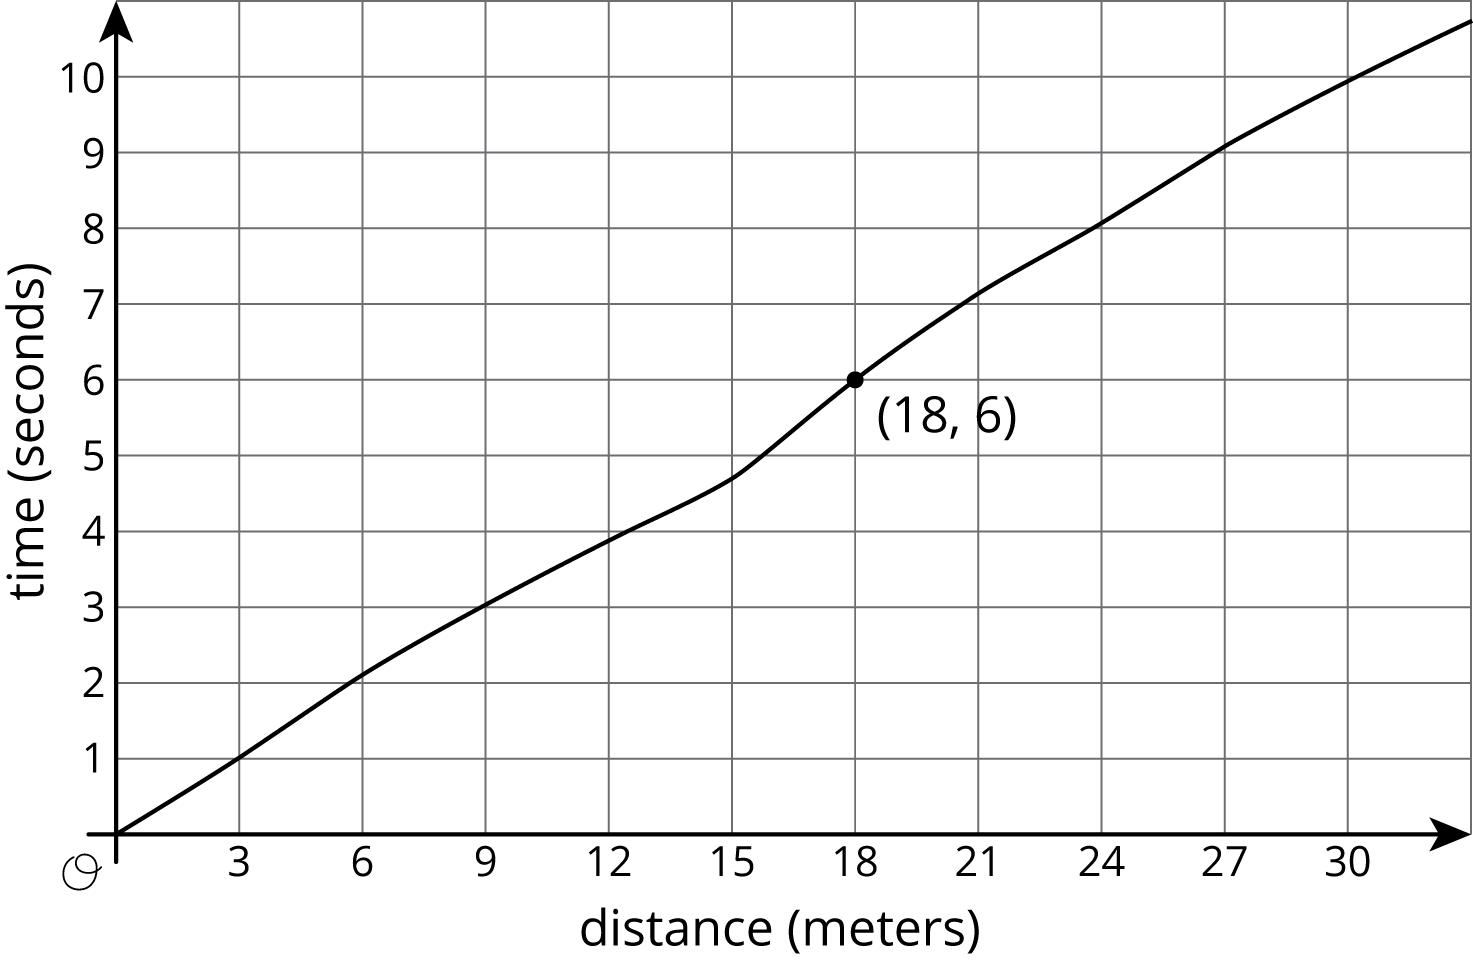
The time in seconds since he started running is a function of the distance he has run. The point (18,6) on the graph tells you that the time it takes him to run 18 meters is 6 seconds. The input is 18 and the output is 6.
The graph of a function is all the coordinate pairs, (input, output), plotted in the coordinate plane. By convention, we always put the input first, which means that the inputs are represented on the horizontal axis and the outputs, on the vertical axis.