7.1: Notice and Wonder: Nonlinear Scatter Plot
What do you notice? What do you wonder?
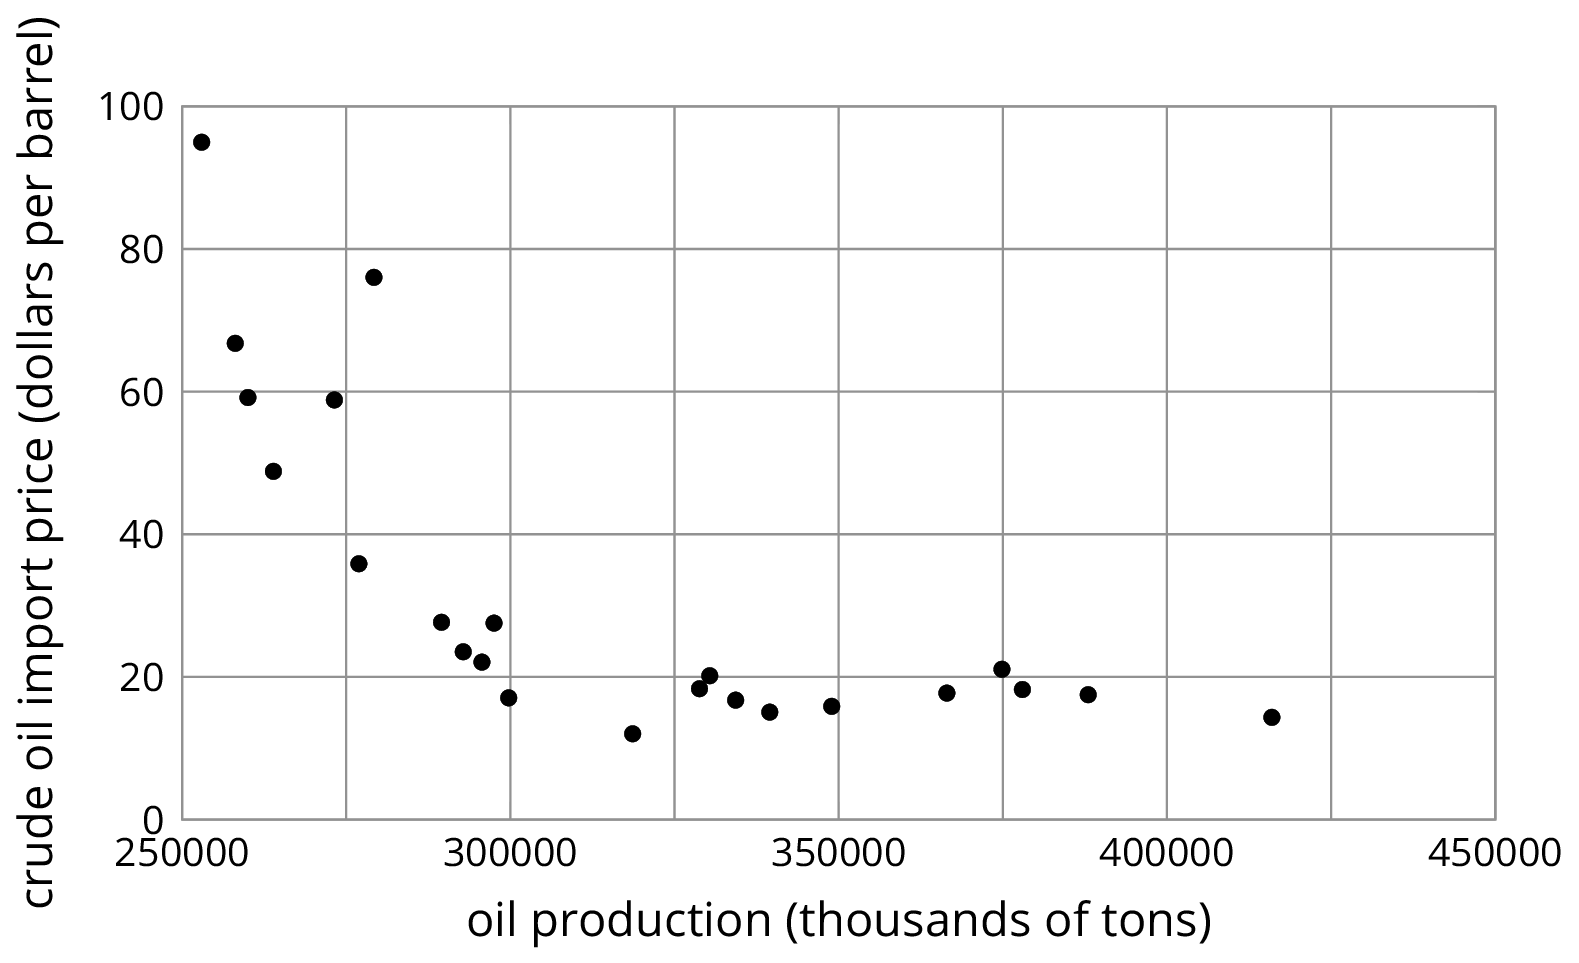
Let's look for other patterns in data.
What do you notice? What do you wonder?
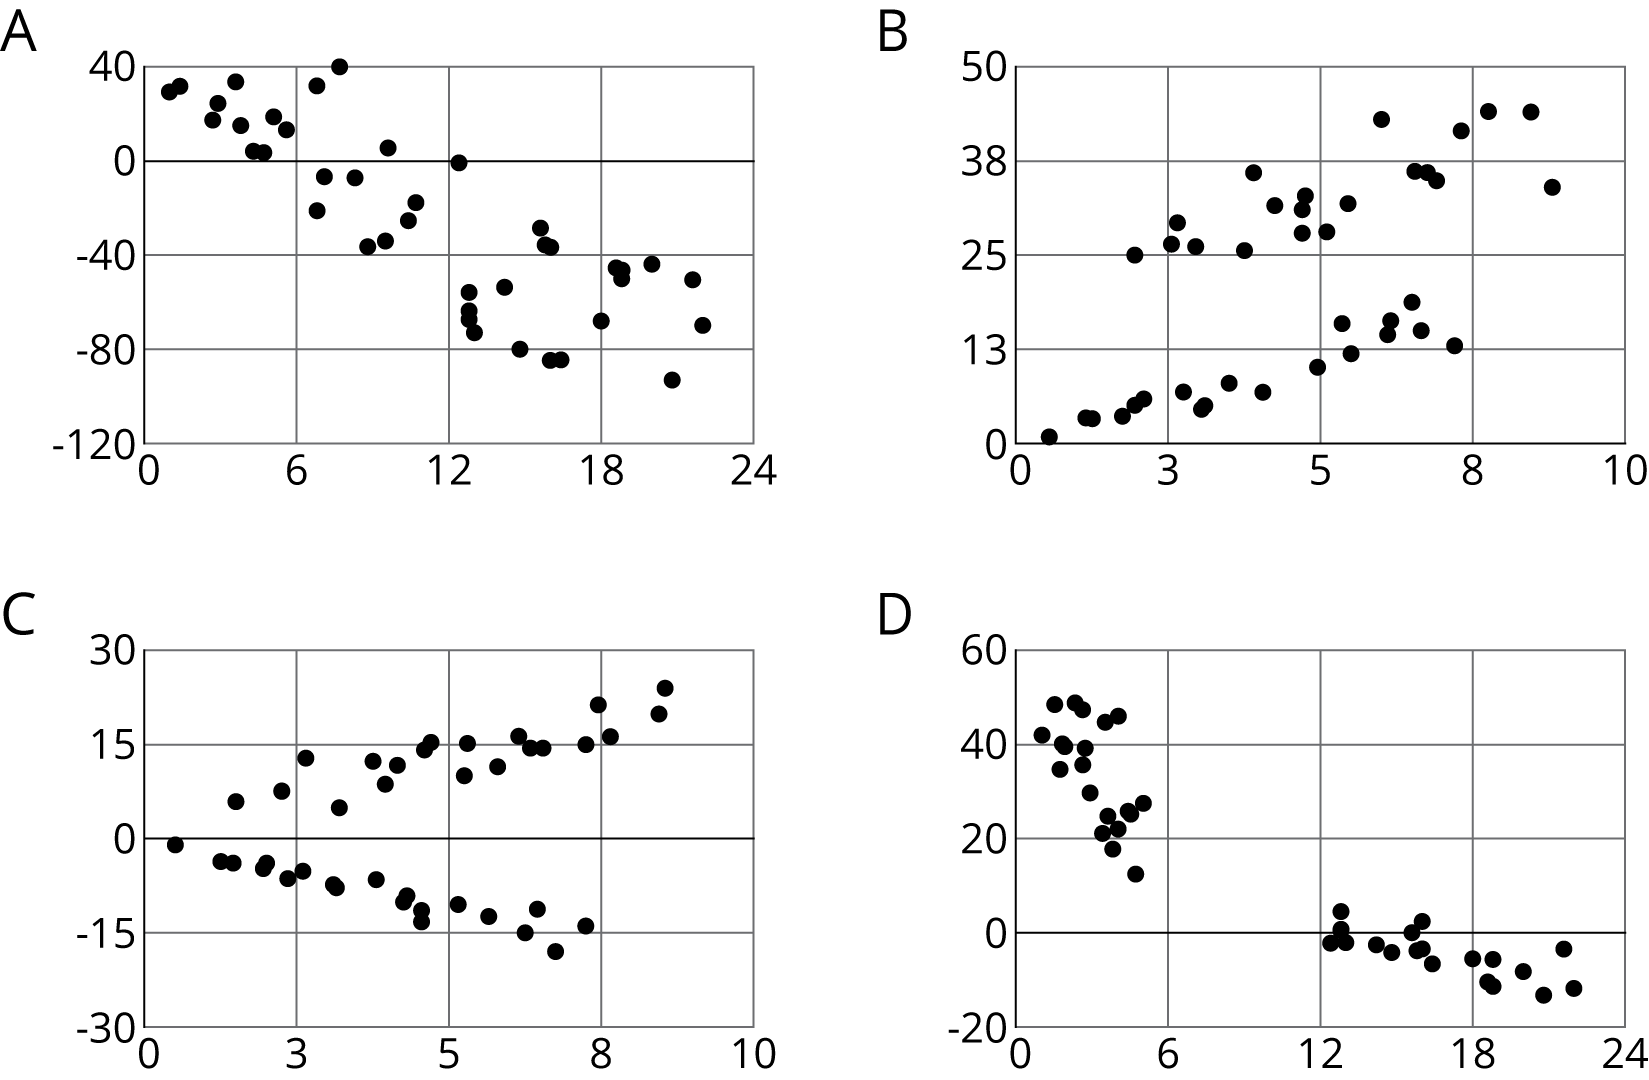
Your teacher will give you a set of cards. Each card shows a scatter plot.
Sort the cards into categories and describe each category.
Explain the reasoning behind your categories to your partner. Listen to your partner’s reasoning for their categories.
Sort the cards into two categories: positive associations and negative associations. Compare your sorting with your partner’s and discuss any disagreements.
Sort the cards into two categories: linear associations and non-linear associations. Compare your sorting with your partner’s and discuss any disagreements.
How are these scatter plots alike? How are they different?
Sometimes a scatter plot shows an association that is not linear:
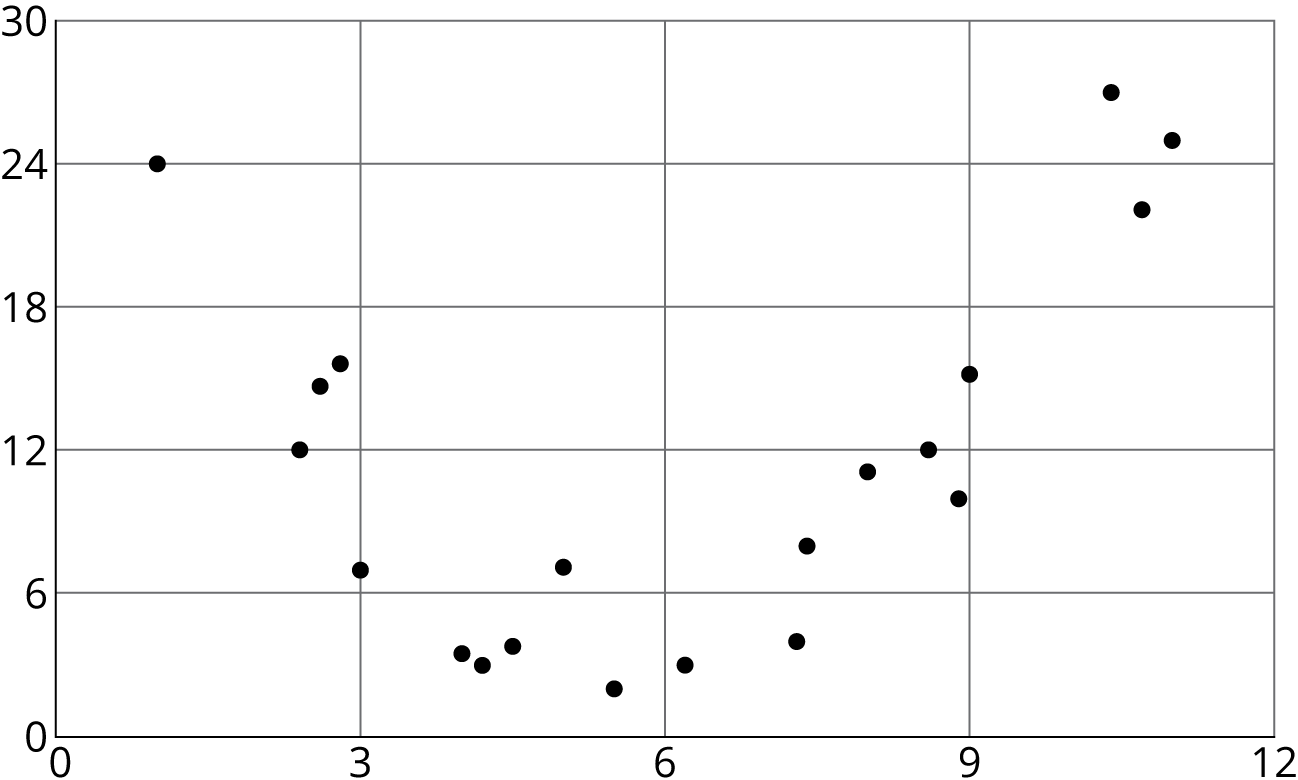
We call such an association a non-linear association. In later grades, you will study functions that can be models for non-linear associations.
Sometimes in a scatter plot we can see separate groups of points.
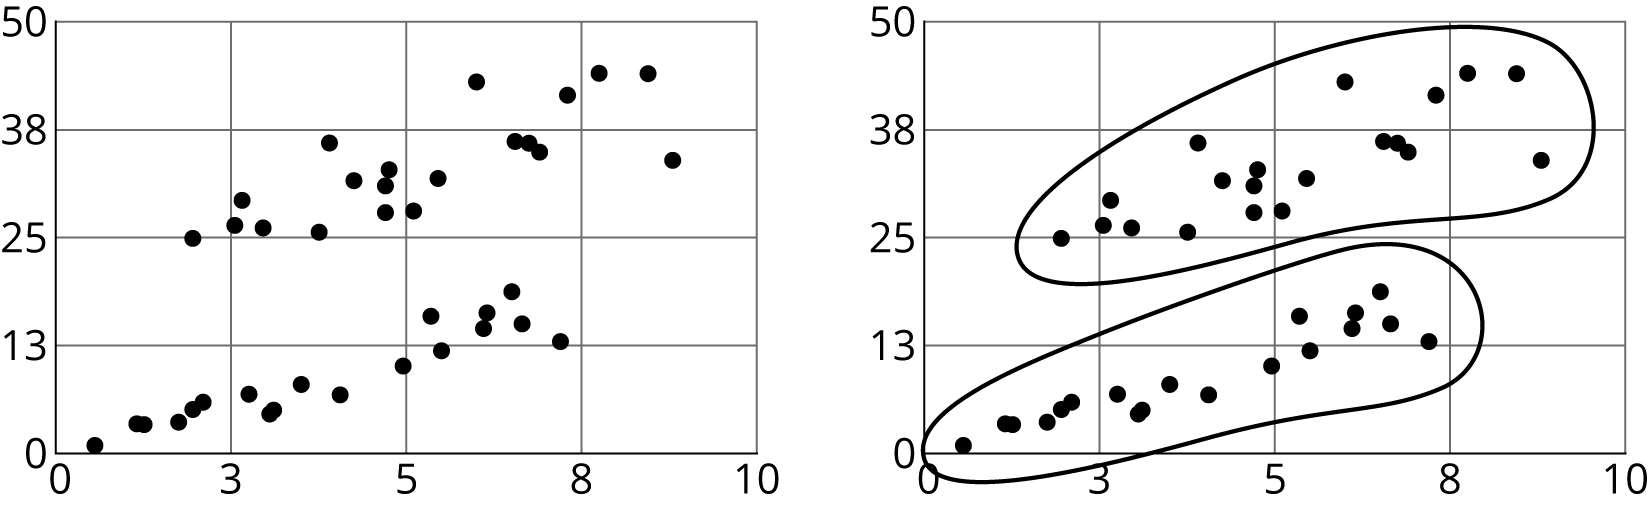
We call these groups clusters.